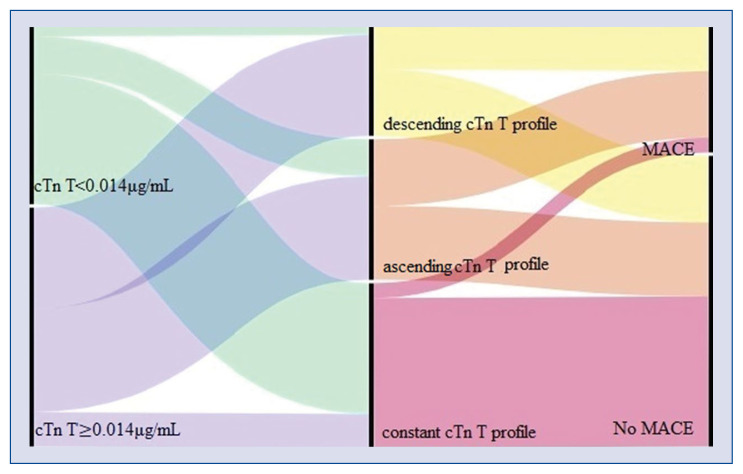
Figure 3.
Alluvial plot illustrating the distribution of values of baseline cardiac troponin T (cTn T) in COVID-19 patients divided into three kinetics profiles according on the values during hospitalization of cardiac troponin (ascending cTn T, descending cTn T, and constant cTn T) and the association with major cardiovascular events. First column: patients were divided into two groups based on the best cut-off value of baseline cTn T of 0.014 μg/mL (green: cTn T< 0.014 μg/mL, purple: cTn T ≥ 0.014 μg/mL), which was shown as an independent predictor for major adverse cardiovascular events (MACE). Second column: patients were separated into three cTn T kinetics profiles: ascending troponin profile (orange), descending troponin profile (yellow), constant troponin profile (pink). Third column: Patients without MACE. Patients with MACE.

