Figure 4.

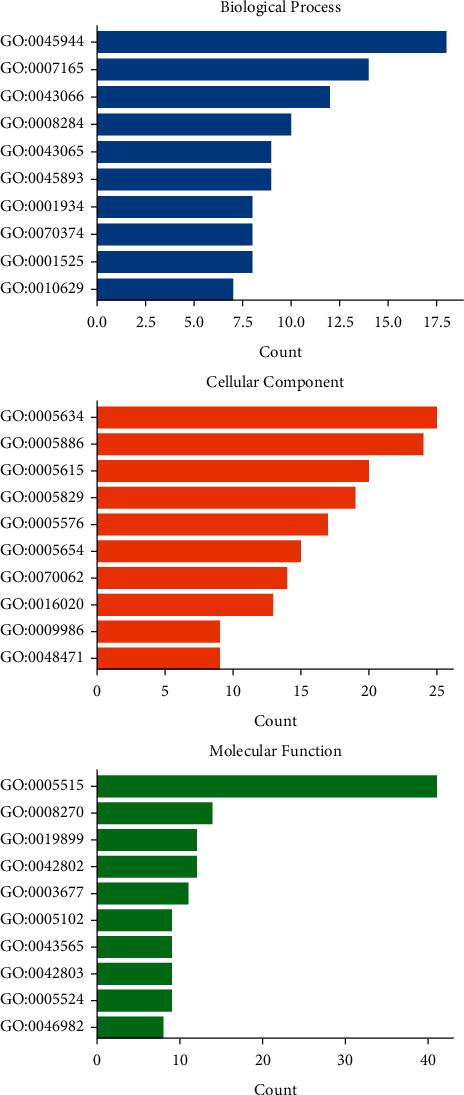
The diagram of the GO enrichment analysis. The Y-axis represents GO terms. The X-axis indicates the number of genes enriched.

The diagram of the GO enrichment analysis. The Y-axis represents GO terms. The X-axis indicates the number of genes enriched.