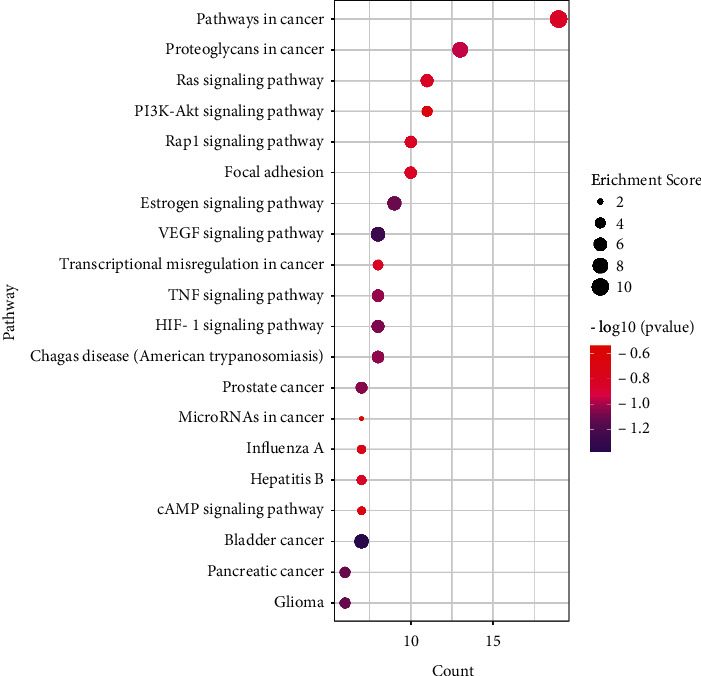
Figure 5.

KEGG enrichment analysis. Count and pathway are represented by the x-axis and y-axis, respectively; the size and color of the dots indicate the enrichment score and the level of P value, respectively.

KEGG enrichment analysis. Count and pathway are represented by the x-axis and y-axis, respectively; the size and color of the dots indicate the enrichment score and the level of P value, respectively.