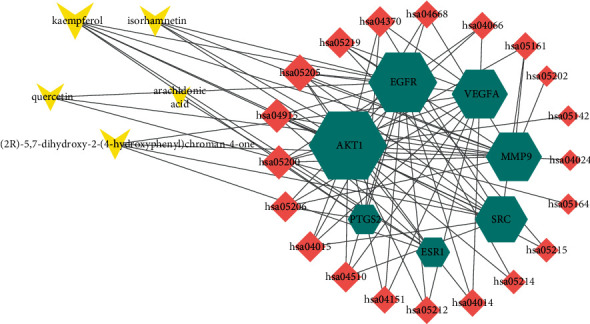
Figure 6.

The ingredient-gene-pathway network. The triangle node in yellow represents active component, the hexagon node in green represents the intersecting targets, and the diamond node in red represents the signaling pathways. The interaction between the components and the targets is represented by the edge.
