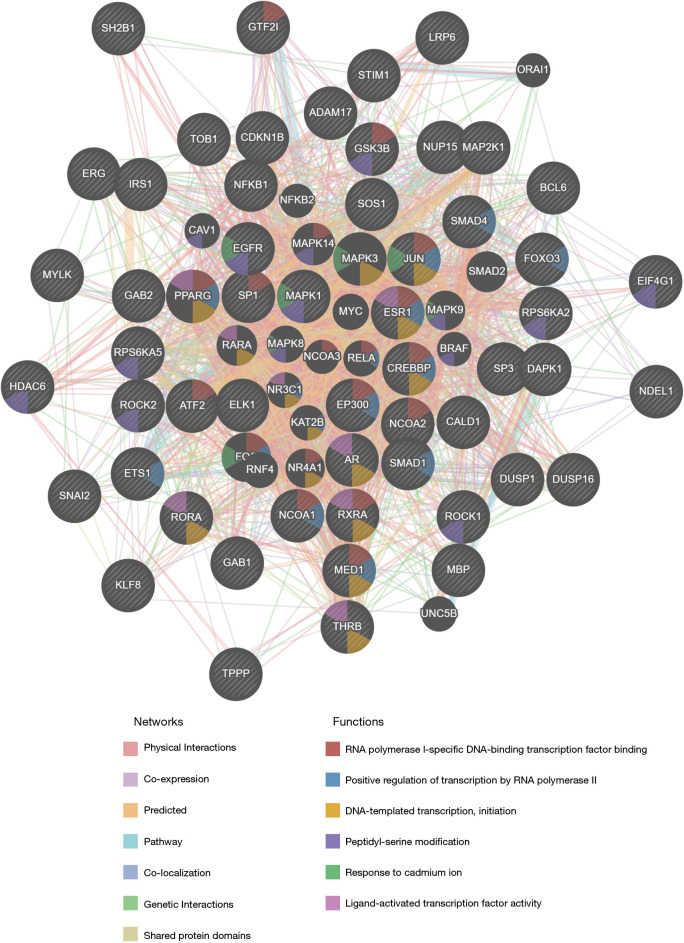
Figure 8.
The protein-protein interaction network of MAPK1 kinase target networks using GeneMANIA. The network and function analyses showing the gene set enrichment using GeneMANIA. The different edge colors represent the different bioinformatics analysis methods: co-expression, website prediction, pathway, physical interactions, and co-localization. The different node colors indicate the different biological functions of the different gene sets.

