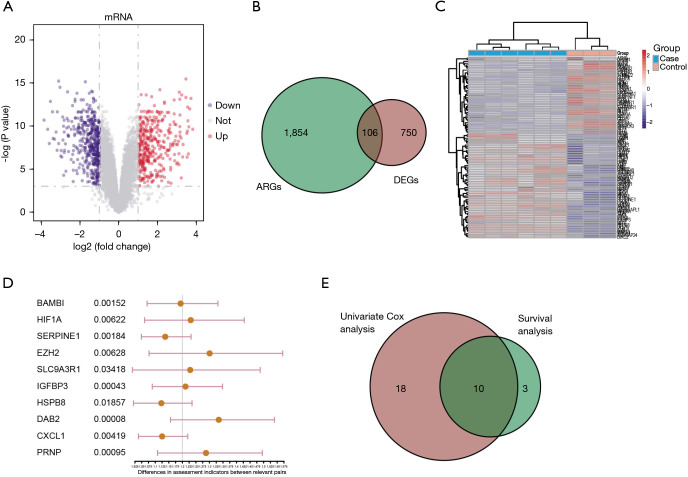
Figure 1.
Identification of dysregulated ARGs in sorafenib-resistant HCC. (A) Volcano plot exhibiting the 856 DE-ARGs in HCC, where up-regulated genes are noted in red, blue genes are noted in blue, and not significant genes are noted in grey. (B) Venn diagram revealing the overlapped genes between ARGs and DEGs. (C) Heatmap plot exhibiting the specific ARGs in HCC, as indicated. (D) Exhibition of results from the univariate Cox regression analysis. (E) Venn graph indicating the overlapped genes between significant genes from Cox regression analysis and those from Kaplan-Meier analysis. ARGs, autophagy-related genes; HCC, hepatocellular carcinoma; DE-ARGs, differentially expressed ARGs; DEGs, differentially expressed genes.

