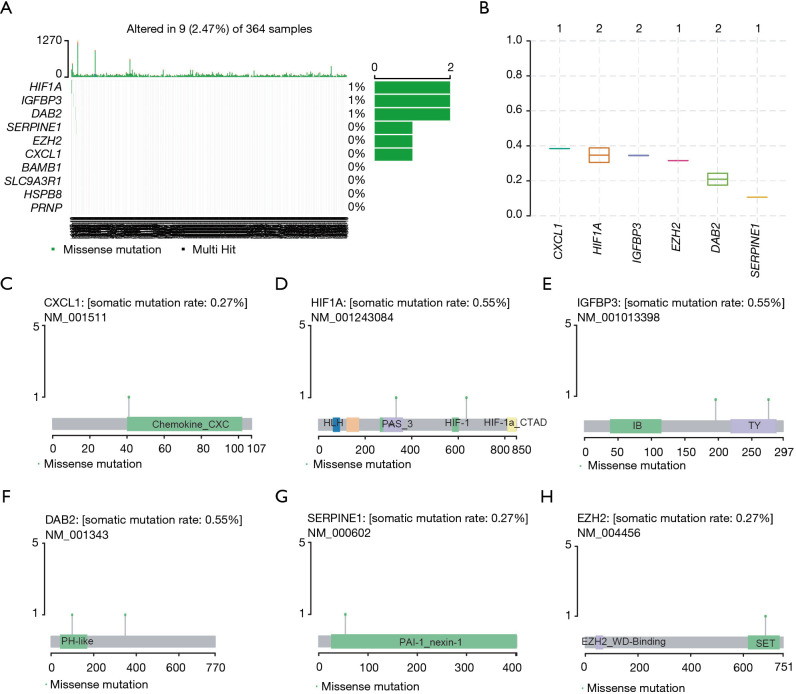
Figure 7.
Differential mutation profiles of ARGs in high- and low-risk HCC samples. (A) SNPs analysis in high- and low-risk groups. (B) Boxplot indicating the mutation frequency. (C) Mutation types and mutation rates of COL15A1 gene, as indicated. (D) Analysis of the distribution of indicated genes across the chromosomes. (E-H) The lollipopPlot visualizing the SNP information of each gene, including IGFBP3 (E), DAB2 (F), SERPINE1 (G), and EZH2 (H). ARGs, autophagy-related genes; HCC, hepatocellular carcinoma; SNPs, single nucleotide polymorphisms.

