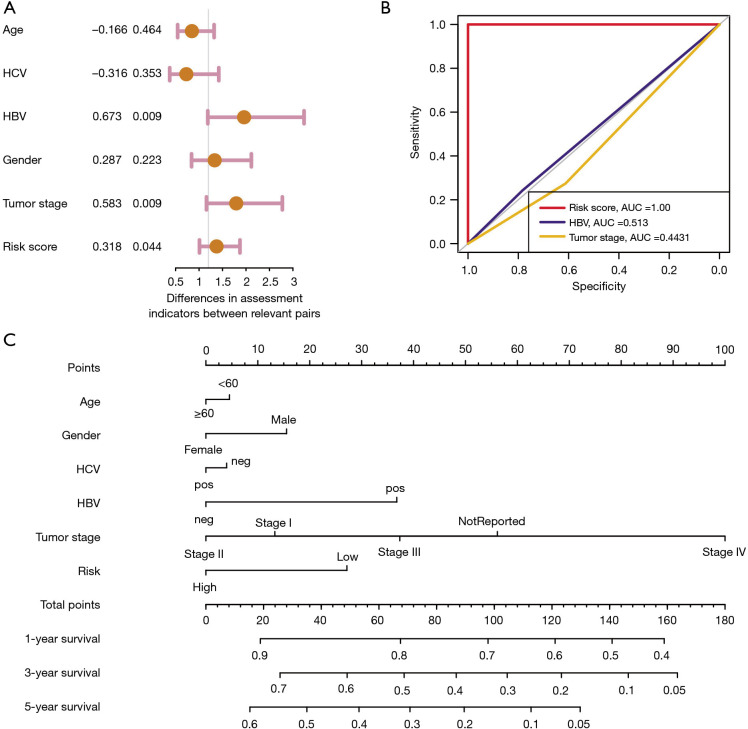
Figure 8.
Independent prognostic analysis of ARGs risk scores. (A) Associations between OS and clinical characteristics. (B) ROC curve showing the predictive efficacy of risk scores of clinical characteristic factors. (C) Nomogram revealing the 1-, 3-, and 5-year of predictive OS probabilities. ARGs, autophagy-related genes; OS, overall survival; ROC, receiver operating characteristic; AUC, area under the curve; HCV, hepatitis C virus; HBV, hepatitis B virus.

