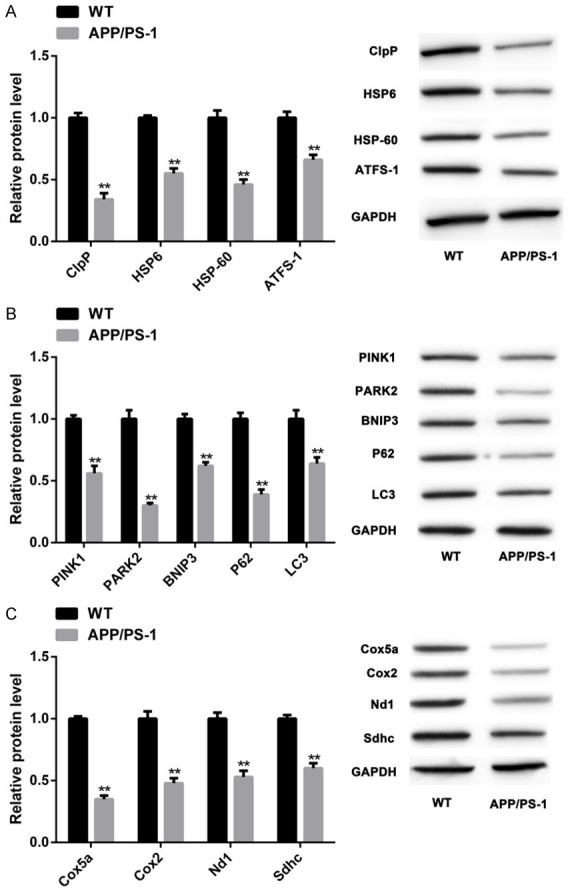
Figure 3.

MSR markers were inhibited in AD models. The protein levels of UPRmt markers in two groups of mice (both n=10) (ClpP, HSP6, HSP-60, ATFS-1) (A), mitochondrial autophagy markers (PINK1, PARK2, BNIP3, P62, LC3) (B), and OXPHOS markers (Cox5a, Cox2, Nd1, Sdhc) (C) were quantified by WB. Note: **P<0.01 vs. WT group.
