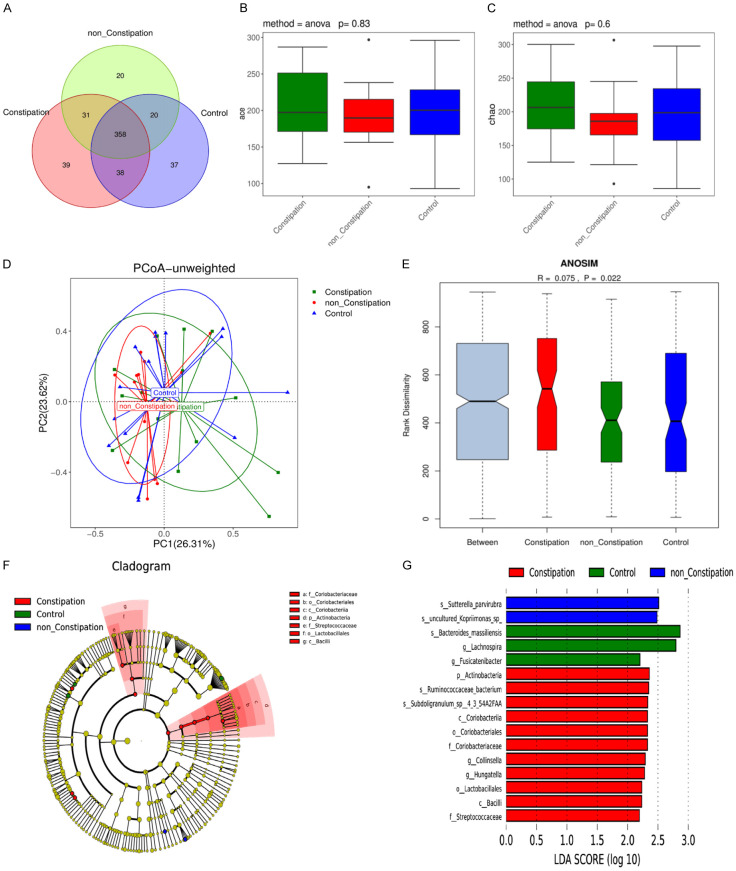
Figure 1.
Gut microbiota composition in PD patients and the healthy controls. A. Venn diagram of the OTUs in the three groups. B, C. Alpha diversity based on OUT. D. Primary coordinate analysis based on unweighted UniFrac (PCoA). E. ANOSIM analysis of the Unweighted UniFrac distances among the three groups. F. Lefse tree diagram. G. Difference contribution analysis chart.

