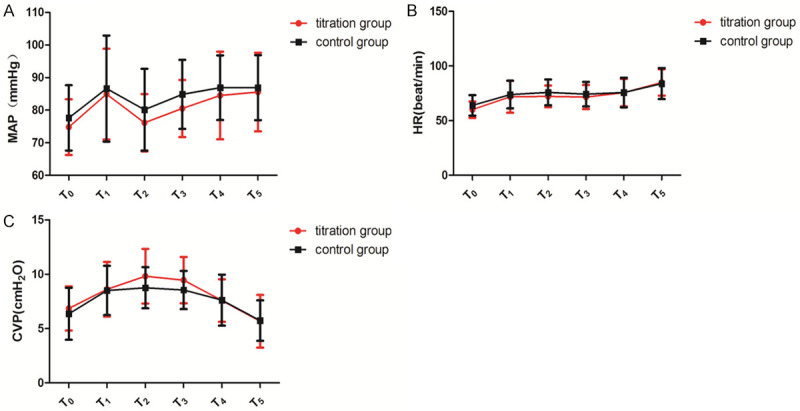
Figure 1.

Comparison of MAP, HR and CVP at different time points between the two groups. A: Comparison of MAP at different time points between the two groups; B: Comparison of HR at different time points between the two groups; C: Comparison of CVP at different time points between the two groups. MAP: mean arterial pressure; HR: heart rate; CVP: central venous pressure.
