
Figure 3.
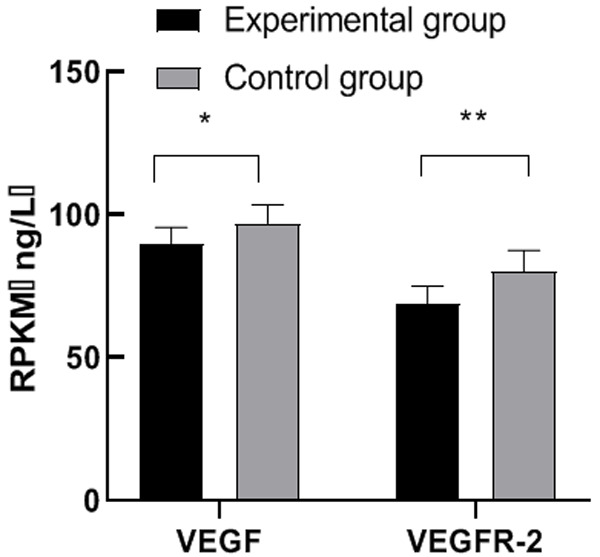
Comparison of VEGF and VEGFR-2 levels after treatment between the two groups. Note: The abscissa represents VEGF and VEGFR-2 from left to right, and the ordinate represents the expression level. Comparison between the VEGF level of the experimental group (89.56±5.88) ng/L and that of the control group (96.88±6.57) ng/L, t=5.87, *P<0.05, and the comparison result was statistically significant; Comparison between the VEGFR-2 level of the experimental group (68.74±6.33) ng/L and that of the control group (80.12±7.42) ng/L, t=8.25, ** P<0.01, and the comparison result was statistically significant.