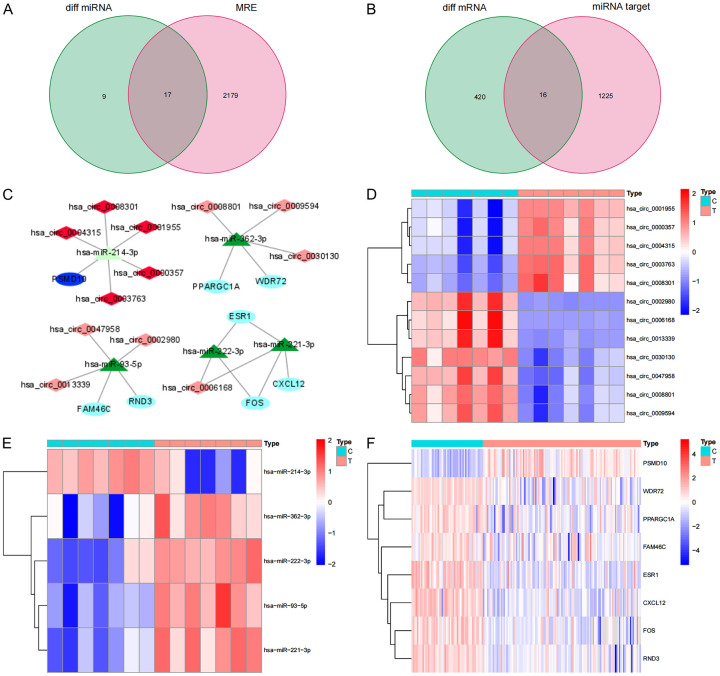
Figure 2.
ceRNA network construction and node differential expression. A. The Venn diagram of the overlap of the target miRNAs predicted by the differential circRNA and the differential miRNA in the GEO database; B. The Venn diagram of the overlap of the target gene predicted by the intersection miRNA and the differential mRNA in the GEO database; C. ceRNA network, Dark red represents the highly expressed of circRNAs, light red represents the low expression of circRNAs, dark green represents the highly expressed of miRNAs, light green represents the low expression of miRNAs, dark blue represents the highly expressed of mRNAs, light blue represents the low expression of mRNAs, and the line represents a regulatory relationship between the two genes; D-F. The differential expression of mRNAs, miRNAs and circRNAs in the ceRNA network in liver cancer tissues and adjacent tissues in the GEO database. C, adjacent non-tumor tissues; T, tumor tissues.

