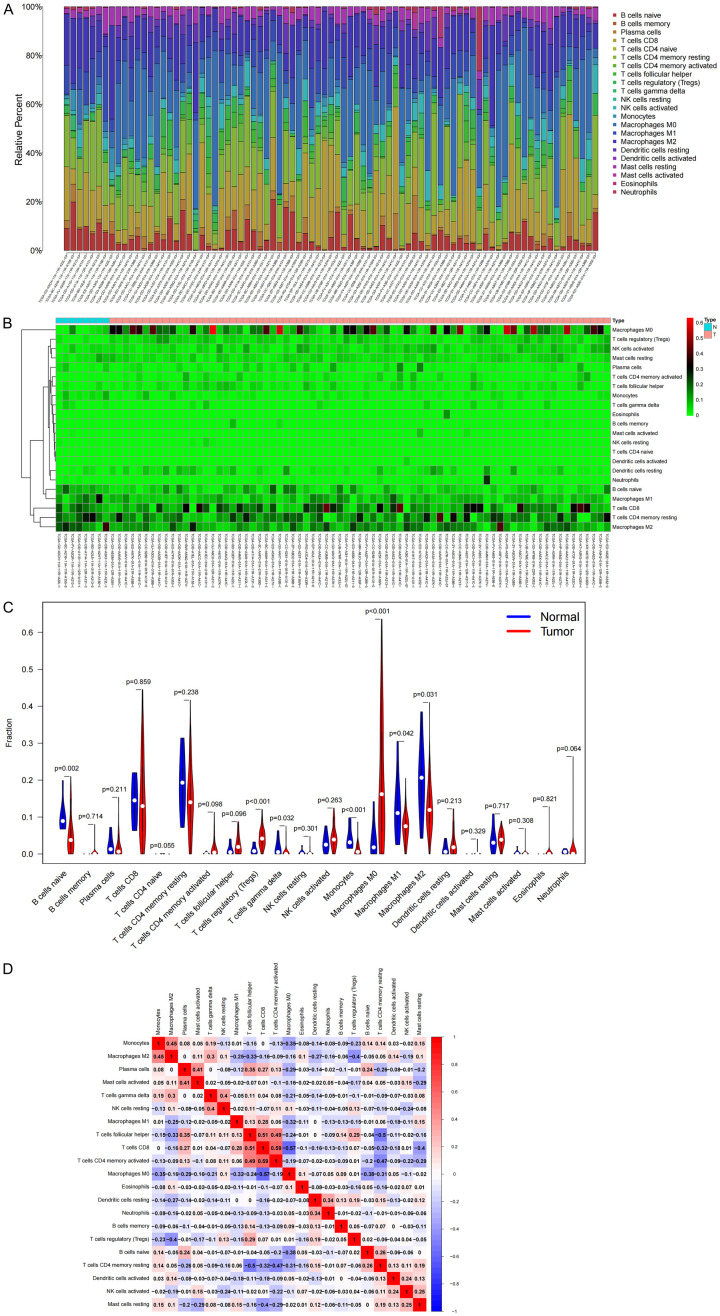
Figure 9.
Immune cell infiltration in HCC and its correlation analysis. A. Histogram of the proportions of 22 TICs in HCC samples and normal samples; B. Heat map of TIC content distribution in HCC samples and normal samples; C. Violin chart of the analysis of different TIC proportions; D. For the correlation between TICs, red is positive correlation, and blue is negative correlation.

