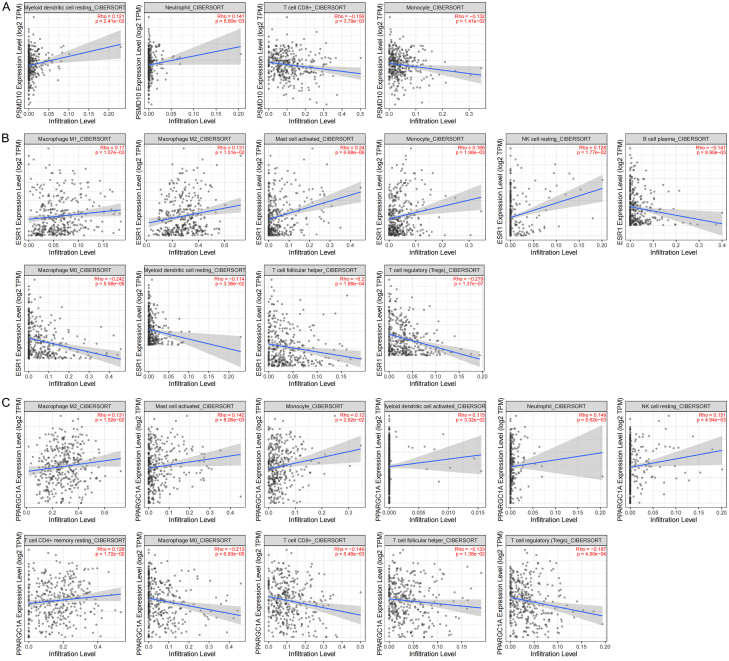
Figure 10.
Correlation analysis between target genes in the ceRNA prognostic subnet and TIC levels. A. Scatter plot of PSMD10 correlation with 4 TICs (P<0.05); B. Scatter plot of ESR1 correlation with 10 TICs (P<0.05); C. Scatter plot of PPARGC1A correlation with 11 TICs (P<0.05); the blue line in each figure is the fitted line that simulates the proportional relationship between the level of gene expression and immune cells.

