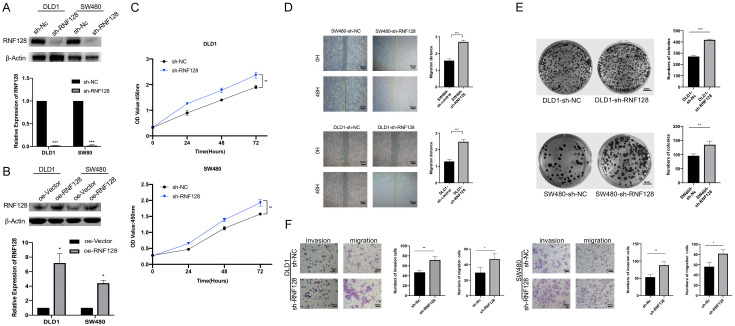
Figure 2.
Knockdown of RNF128 promotes colorectal cancer cell growth, migration and invasion. (A) Expression levels of RNF128 in DLD1 and SW480 cells transfected with shRNA targeting RNF128 (sh-RNF128) or a control shRNA (sh-NC). (B) Expression levels of RNF128 in DLD1 and SW480 cells transfected with RNF128 plasmids (oe-RNF128) or an empty vector plasmid (oe-Vector). (C) CCK8 proliferation assays performed in DLD1 and SW480 cells transfected with sh-RNF128 and sh-control. (D) The migration ability of the RNF128 knockdown cells was examined using scratch assay. Relative quantitative comparison of scratch width was determined. (E) Colony formation assays performed in DLD1 and SW480 cells transfected with shRNA targeting RNF128 (sh-RNF128) or a control shRNA (sh-NC). The numbers of clones formed in each group were counted and compared. (F) Cell invasion and migration assays were performed and quantified in RNF128 knockdown and control of DLD1 and SW480 cells, respectively. *P<0.05, **P<0.01 and ***P<0.001. Data represented as mean ± SD. Scratch wound assay for (D): ×40, scale bar: 500 μm. Clonogenicity assay (E) for scale bar: 5 mm. Transwell migration and invasion assays for (F): ×100, scale bar: 100 μm.

