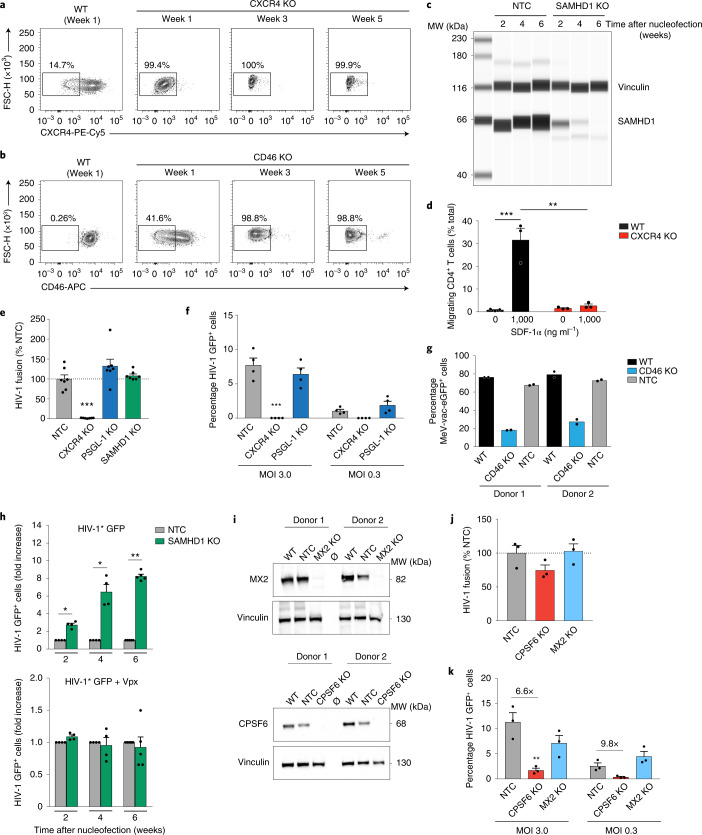
Fig. 3. Phenotypic characterization of various single-gene KOs in polyclonal, resting CD4+ T cells.
a,b, FACS density plots of surface-exposed CXCR4 (a) or CD46 (b) from one experiment at three time points (n = 3). c, WES immunoblot for SAMHD1 in cultivated KO or NTC cells. Vinculin was the loading control. One representative experiment is shown (n = 4). d, SDF-1α (CXCL12)-driven chemotaxis of cells 1 week after nucleofection. Mean ± s.e.m. are shown (n = 3). Statistics indicate significance by two-way ANOVA. P values were corrected for multiple comparison (Tukey) (***P = 0.0007; **P = 0.0010). e, The frequency of cells (NTC or indicated KOs) positive for cleaved CCF2 substrate after challenge with HIV-1 carrying BlaM-Vpr, indicative of HIV-1 fusion, was determined by flow cytometry. Mean ± s.e.m. are shown (n = 7). Statistics indicate significance by one-way ANOVA. P values were corrected for multiple comparisons (Dunnet) (***P = 0.0002). f, Cells with the indicated KOs were challenged 2 weeks after nucleofection with HIV-1 GFP at two MOIs and analyzed 3 d later. Mean ± s.e.m. are shown (n = 4). Statistics indicate significance by two-way ANOVA. P values were corrected for multiple comparisons (Tukey) (***P = ≤ 0.001). g, Cells were challenged 2 weeks after nucleofection with measles reporter virus MeV-vac-eGFP and analyzed for reporter expression by flow cytometry 1 d later. Means of technical duplicates are shown (n = 2). h, At the indicated weeks after nucleofection, SAMHD1 KO cells or NTC control cells were challenged with HIV-1* GFP either without Vpx (top) or carrying Vpx (+Vpx, bottom) and analyzed 3 d later by flow cytometry. Infection values for the NTC control were set to 1. Mean ± s.e.m. are shown (n = 5). Statistics indicate significance by two-tailed Mann–Whitney U-test. (2 weeks, *P = 0.0286; 4 weeks, *P = 0.0286; 6 weeks, **P = 0.0079). i, Immunoblots for MX2 (top) or CPSF6 (bottom) in cell lysates 4 weeks after nucleofection. Vinculin was the loading control. Two representative donors are shown (n = 4). Ø, empty lane. j,k, HIV-1 fusion (j) and HIV-1 GFP infection (k) in cells with the indicated KOs 4 weeks after nucleofection (as in e and f, respectively). Mean ± s.e.m. are shown (n = 3). Statistics indicate significance by two-way ANOVA. P values were corrected for multiple comparison (Dunnet) (**P = 0.0054).

