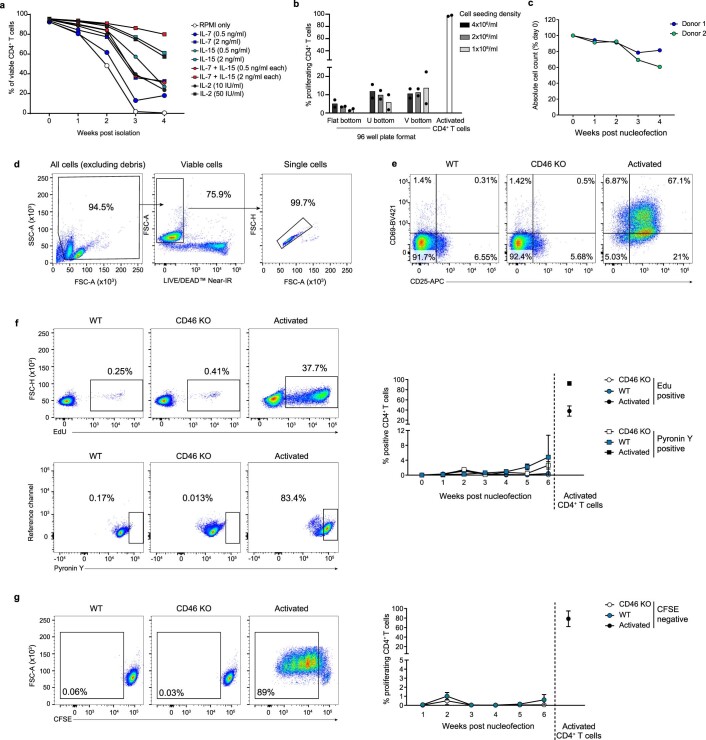
Extended Data Fig. 1. Basic culture conditions to keep human CD4+ T cells viable and resting.
a, Combined IL-7/IL-15 treatment is optimal for resting CD4+ T cells. Primary CD4+ T cells were enriched from PBMCs from healthy donors using the EasySep Rosette Human CD4+ T Cell enrichment kit (negative selection). Isolated cells were kept in culture for 4 weeks with the addition of the indicated interleukins to the culture medium. The interleukin supplement was refreshed twice a week. Once a week an aliquot of cells was analyzed by staining with LIVE/DEADTM Fixable Near-IR Dead Cell Stain to assess the culture’s viability. Means are shown (n = 2). b, Resting CD4+ T cells were labeled with CFSE, seeded at the indicated cell concentrations and plate formats (flat bottom, U bottom, V bottom), and maintained in culture with medium containing IL-7/IL-15 (both 2 ng/ml). Two weeks later, cell proliferation was assessed by flow cytometry. Means are shown (n = 2). Anti-CD3/CD28 mAb-activated CD4+ T cells served as positive control. c, Once a week over a period of four weeks WT cells were analyzed by flow cytometry using BD Trucount™ Tubes to assess absolute cell counts. Data from two independent donors are shown. d, Gating strategy to assess cell viability by staining with LIVE/DEADTM Fixable Near-IR Dead Cell Stain. e-g, RNP nucleofection per se does not alter cell’s activation state. Resting CD4+ T cells were nucleofected with RNPs specific for CD46 (gRNA1 + 2), and CD46 KO cells and WT cells were maintained in culture with medium containing IL-7/IL-15 (both 2 ng/ml) and (e) analyzed two weeks later for expression of T cell activation markers CD25 and CD69. Anti-CD3/CD28 mAb-activated CD4+ T cells served as positive control. f,g, Once a week over a period of six weeks, cells were also analyzed by flow cytometry for the following parameters: DNA synthesis by EdU incorporation assay (f, top panels), RNA content quantification by Pyronin Y staining (f, bottom panels), cell proliferation by CFSE staining (g). Left panels show one representative example at week 2 after nucleofection. Right panels are the summary of all results with means ± s.e.m. (n = 3). Note that EdU incorporation scores cell division only at the time point of analysis, while CSFE analysis tracks cell division events during the entire cultivation period. Typically, both markers stayed below 1% positivity in cultures for up to 6 weeks, consistent with a lack of proliferation.

