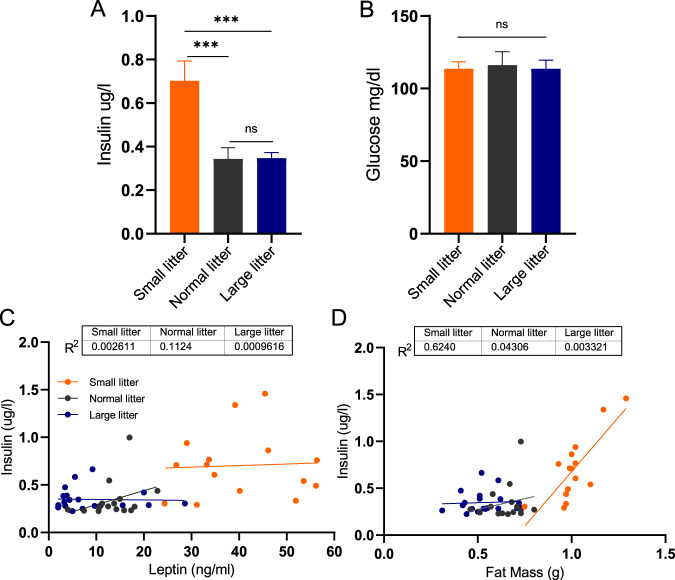
Fig. 4. Over- and undernutrition effects on circulating insulin and glucose concentrations at P10.
Mean plasma insulin (n = 15–20 mice per group) (A) and venous plasma glucose (n = 9–11 mice per group) (B) in pups raised in small (orange), normal (gray), or large (blue) litters measured on postnatal day 10 during the peak of plasma leptin surge. Regression of plasma leptin concentrations (C) or fat mass (D) vs. insulin for each of the litter size group. Difference in plasma insulin and glucose concentrations among the groups were tested with one-way ANOVA with Tukey post hoc at the 5% level of significance; ***p < 0.001; ns denotes nonsignificant difference.

