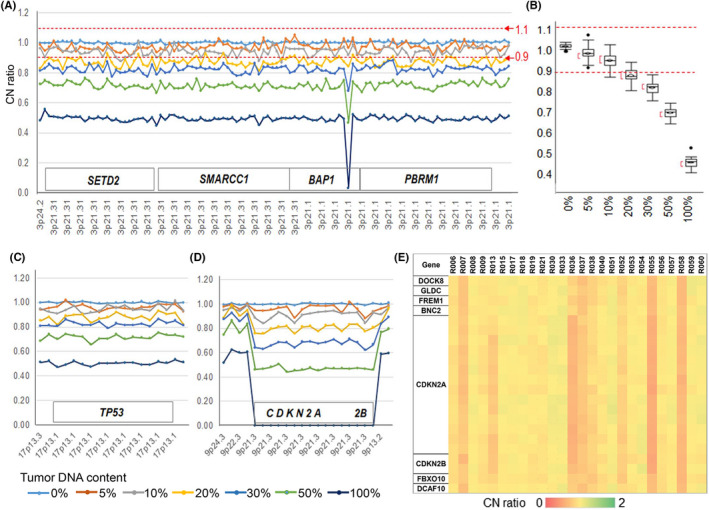
FIGURE 2.

Titration experimental results of tumor cell line DNA into normal DNA from neonatal human epidermal keratinocytes (HEKn). A, CN ratio plot in the 3p21 region for DNA titration from tumor cell line HMMME. B, Box plot showing CN deviation of experiment A, omitting 1 probe showing biallelic deletion in exon 7 of BAP1; the average CN ratio was 1.002 at 0%, 0.972 at 5%, 0.941 at 10%, 0.874 at 20%, 0.824 at 30%, 0.717 at 50%, 0.495 at 100% of HMMME DNA. C, CN ratio plot in the 17p13 region for DNA titration from HMMME. D, CN ratio plot in the 9p region for DNA titration from tumor cell line H2452. In this experiment, 100% DNA from normal cells HEKn (n = 6) was used for normalization. E, CN ratio in the 9p region for ccRCCs with metastasis. Three cases, R13, R36, and R55, had biallelic CN losses in CDKN2A/2B
