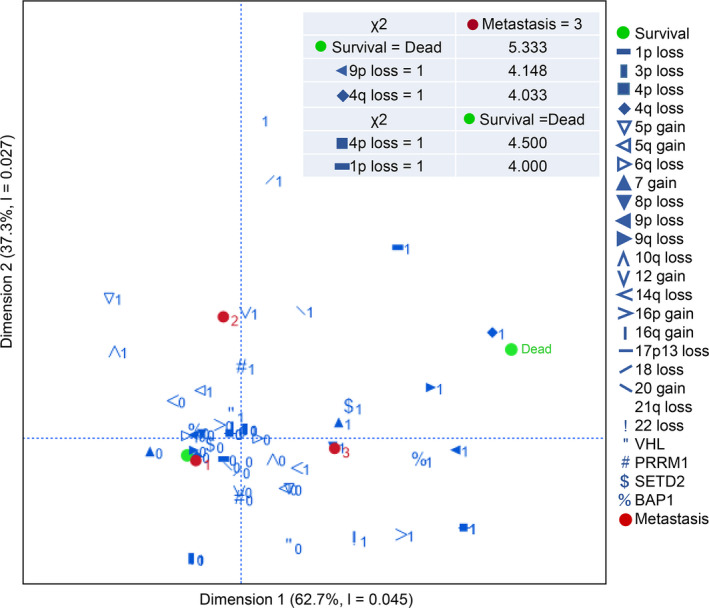
FIGURE 5.

Multiple correspondence analysis among the metastatic status (1: metastasis‐free, 2: late metastasis, ≥1 y, 3: early metastasis, <1 y after tumorectomy) and each characteristic (1: CN alteration or nucleotide‐level mutation detected, 0: not detected). The chi‐squared test for independence on 2 categorical variables was conducted and χ 2 values associated with early metastasis or with poor survival are described in the figure. The critical value at the .05 level (P = .05) in 1 degree of freedom is 3.841
