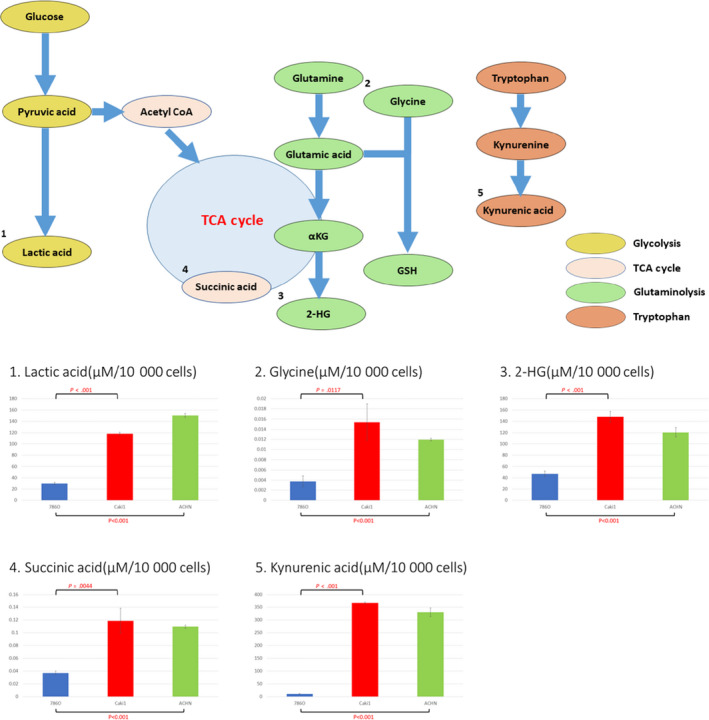
FIGURE 4.

Relationships between five selected metabolites and their metabolic pathways and comparisons of their intracellular concentrations among three renal cell carcinoma cell lines, 786‐O, Caki‐1, and ACHN. 2‐HG, 2‐hydroxyglutarate; αKG, α‐ketoglutaric acid; GSH, glutathione; TCA, tricarboxylic acid
