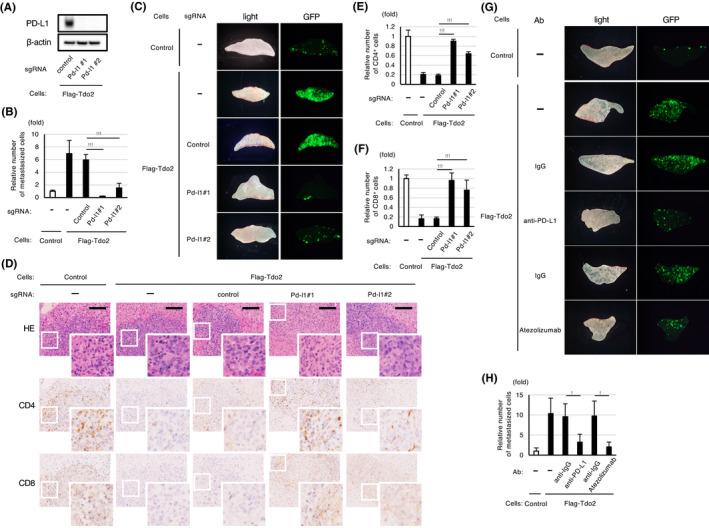
FIGURE 4.

Pd‐l1 is required for the Tdo2‐mediated promotion of liver metastasis and suppression of immune responses. A, Western blot analyses of Pd‐l1 expression in CT26 cells expressing Flag‐Tdo2 subjected to Pd‐l1 (Pd‐l1#1 and #2) or control knockout. B, Abolishment of Tdo2‐mediated liver metastasis by knocking out Pd‐l1. C, Representative GFP images of the liver after splenic injection of the CT26 cells shown in (B). D, Restoration of T cell accumulation in liver metastases generated by Pd‐l1–knockout cells. H&E staining and immunohistochemical analyses for the indicated lymphocytes. Scale bar: 100 μm. E, F, Relative numbers of tumor‐infiltrating CD4‐ and CD8‐positive cells in the indicated tumors. Quantification of relative cell number was performed as described in Figure 3B (n = 3). G, H, Inhibition of Tdo2‐mediated liver metastasis with neutralizing anti‐PD‐L1 antibodies after splenic injection of the indicated CT26 cells. CT26/Flag‐Tdo2 cells were incubated with the indicated antibodies for 48 h and then used for splenic injection. G, Representative GFP images of the liver after splenic injection. H, The extent of inhibition determined by measuring the relative numbers of liver‐metastasized CT26 cells. Values represent the mean ± SD; *P < .05, **P < .01, ***P < .001
