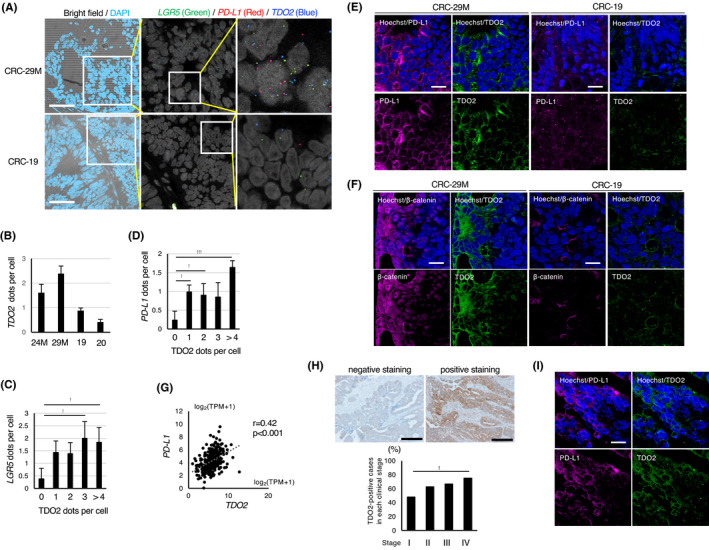
FIGURE 7.

TDO2 is coexpressed with LGR5 and PD‐L1 in colon tumors and positively associated with PD‐L1 expression in clinical specimens. A, In situ RNA hybridization of xenograft tumors derived from cancer spheroids. Left: Merged images of bright‐field microscopy and DAPI staining of the tumors derived from CRC‐29 M and CRC‐19. Scale bar: 50 µm. Middle and right: In situ RNA hybridization with LGR5 (green), PD‐L1 (red), and TDO2 (blue) probes. Images acquired at a higher magnification are shown on the right. B, Average numbers of TDO2‐hybridizing dots per cells in the indicated xenograft tumors. C, D, Correlation of the average number of hybridizing dots for (C) LGR5 or (D) PD‐L1 with the indicated number of dots for TDO2 in xenografted tumors (CRC‐29 M). E, Representative coimmunostaining of xenograft tumors (CRC‐29 M and CRC‐19) for PD‐L1 and TDO2. Scale bar: 10 µm. F, Representative coimmunostaining of xenograft tumors (CRC‐29 M and CRC‐19) for β‐catenin and TDO2. Scale bar: 10 µm. G, Positive association between PD‐L1 and TDO2 mRNA expression in clinical specimens of colon cancer from The Cancer Genome Atlas (TCGA) database. H, Immunohistochemical analyses of TDO2 in clinical specimens of human colon cancers. Top: Representative images of negative and positive staining. Scale bar: 400 μm. Bottom: Proportion of TDO2‐positive cases in each clinical stage is shown. I, Representative coimmunostaining of surgical specimens of primary colon cancer of patients with liver metastasis. Scale bar: 10 µm. Values represent the mean ± SD; *P < .05, **P < .01, ***P < .001
