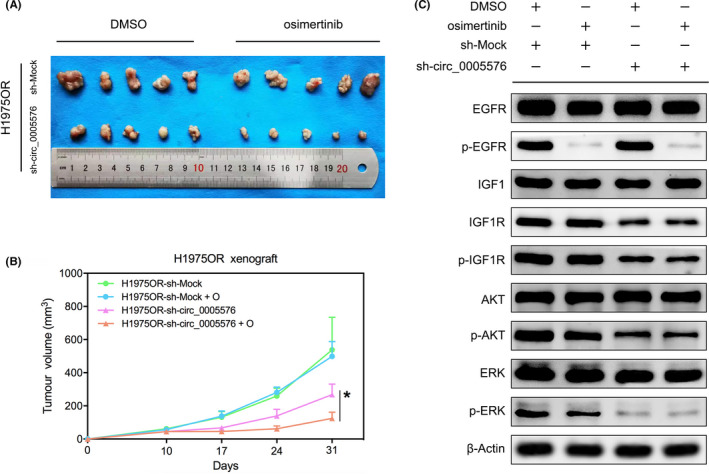
FIGURE 6.

A, BALB/c nude mice were given H1975OR cells transfected with or without sh‐circ_0005576 and then treated with DMSO or osimertinib (20 mg/kg/d) for 21 d. B, Growth curve of xenograft tumors (n = 5). C, Western blot analysis of the protein expression of the largest xenograft tumor in each group. *P < .05
