
FIGURE 3.
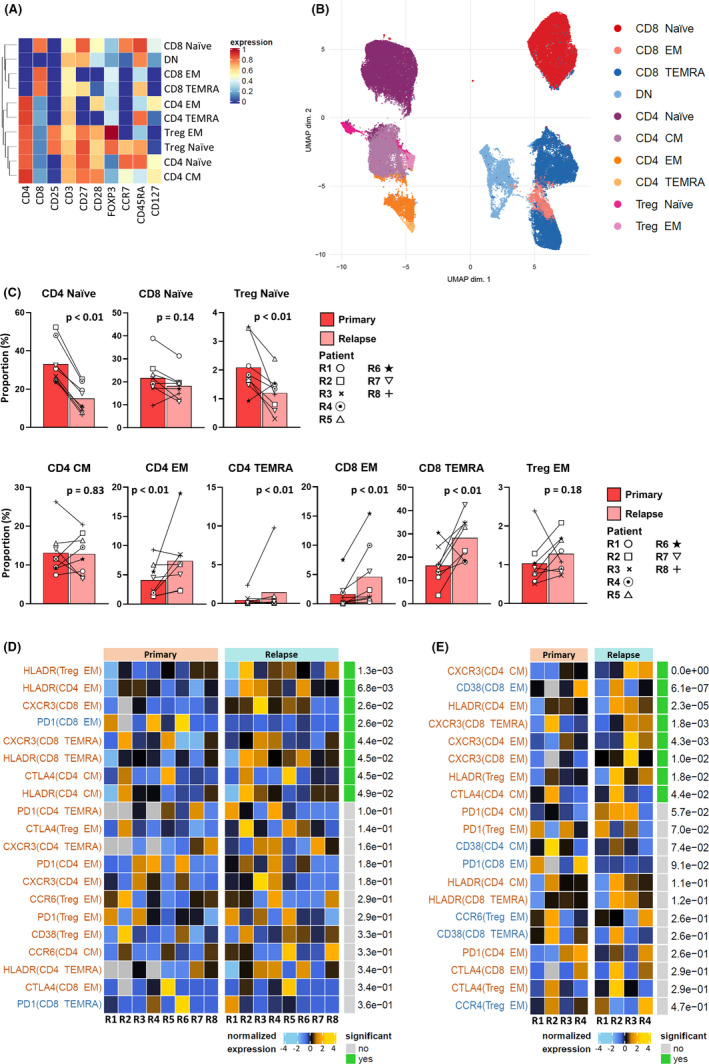
Serial mass cytometric analysis of T cells in bone marrow (BM) reveals dynamic immunological alteration to a T helper 1‐dominant tumor immune environment in recurrent B cell precursor acute lymphoblastic leukemia (BCP‐ALL). A, BM T cells from primary and recurrent BCP‐ALL samples classified into 10 subgroups using FlowSOM with manual merging. The type markers used in clustering are displayed as a heatmap. B, Dimensional reduction graph (UMAP) of T cells colored by subgroup identity. C, An increase in effector T cell subgroups was observed at relapse. Differential abundance analysis carried out using a generalized linear mixed model to calculate adjusted P values. D, Differential state test results and normalized expression of state markers by effector T cells in serial primary and relapse samples from eight patients. The top 20 state marker‐subgroup combinations are sorted according to adjusted P values calculated using a linear mixed model. Combinations upregulated at relapse are colored red; those downregulated are blue. E, Differential state test results and normalized expression of state markers in effector T cells, focusing on four patients without therapeutic effects at relapse. The top 20 state marker‐subgroup combinations are sorted according to adjusted P values calculated using a linear mixed model. Combinations upregulated at relapse are colored red; those downregulated are blue. CM, central memory; DN, double negative; EM, effector memory; TEMRA, terminally differentiated effector memory; Treg, regulatory T cell