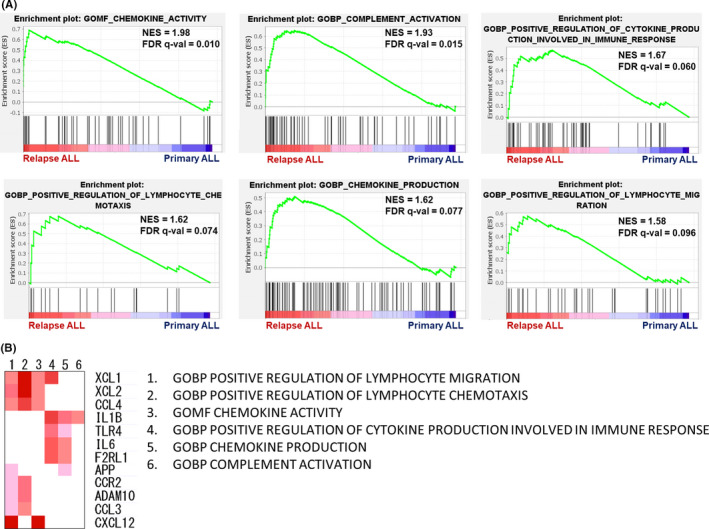
FIGURE 6.

Transcriptional analysis identifies immune‐related pathways broadly upregulated in recurrent B cell precursor acute lymphoblastic leukemia cells. The result of gene set enrichment analysis of gene ontology gene sets are shown. A, Chemokine activity, chemokine production, complement activation, positive regulation of cytokine production involved in immune response, positive regulation of lymphocyte chemotaxis, and positive regulation of lymphocyte migration are illustrated as enrichment plots. B, Heatmap of the results of leading edge analysis using the six significantly upregulated immune response gene sets. Expression values of genes in each leading edge subset gene set are represented in red, and genes contained in at least two different gene sets are shown. NES, normalized enrichment score; FDR, false discovery rate; GOBP, gene ontology biological process; GOMF, gene ontology molecular function
