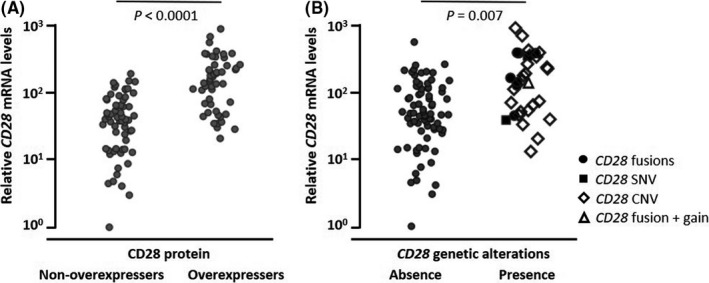
FIGURE 3.

Correlations of CD28 messenger RNA (mRNA) levels, CD28 protein expression, and CD28 genetic alterations. Relative CD28 mRNA levels stratified according to CD28 protein expression (A) or CD28 genetic alterations (B). Relative CD28 mRNA levels are plotted on the y‐axis. Each dot plot in the panels represents an individual adult T‐cell leukemia/lymphoma (ATLL) case. The significance of the differences in CD28 mRNA levels was assessed by the Mann‐Whitney U test, and P‐values are indicated in each panel. CNV, copy number variation; SNV, single‐nucleotide variant
