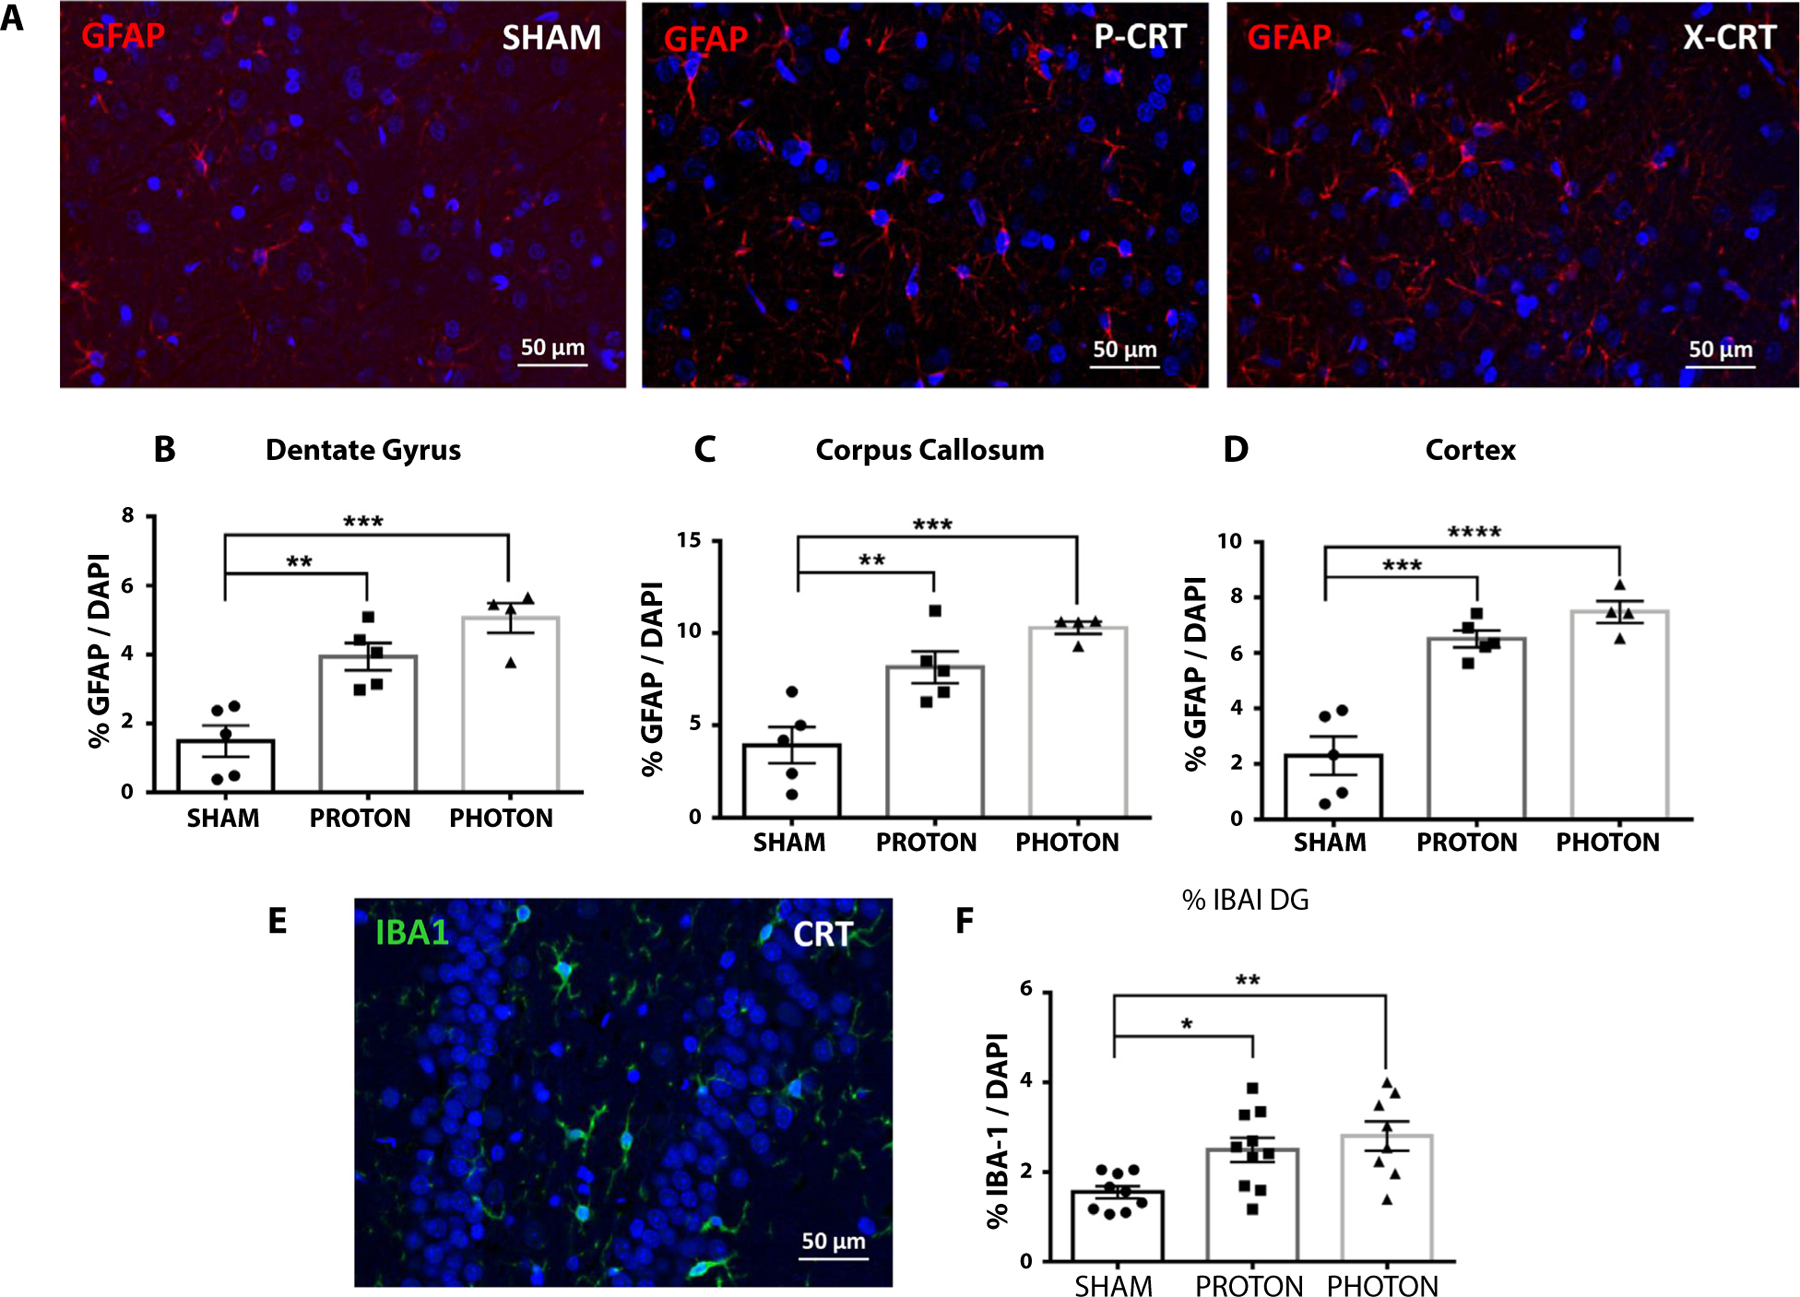
Fig. 5.

Neuroinflammation was observed throughout the brain at 12 months post-CRT. (A) Brain sections immunostained for glial fibrillary acidic protein (GFAP) in sham, P-CRT, and X-CRT cortexes. An increase in GFAP positive cells was observed throughout the brain in the (B) dentate gyrus, (C) corpus callosum, and (D) cortex. (E) Brain section stained for activated microglia in the dentate gryus. (F) Quantification of ionized calcium binding adaptor molecule 1 (IBA-1)−positive cells in the dentate gyrus. Counting was done in duplicate. Mean ± standard error of the mean are shown, n = 4–5 animals/group. *P < .05, **P < .01, ***P < .001, and ***P < .0001. Scale bar represents 50 μm. Abbreviations: CRT = cranial radiation therapy; P-CRT = proton cranial radiation therapy; X-CRT = photon cranial radiation therapy.
