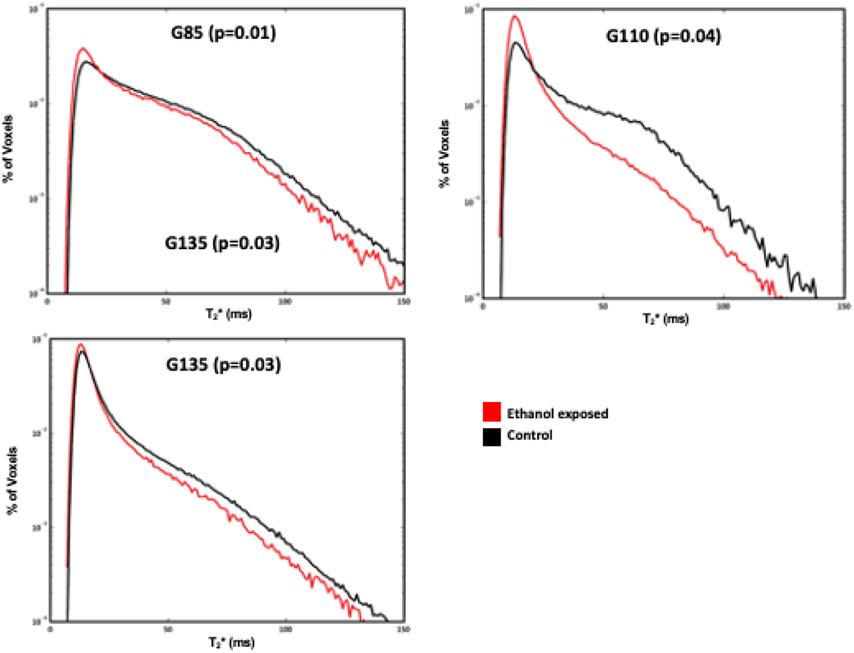
Figure 2. Histogram plot of T2* versus percent of placental voxels displayed for ethanol-exposed (red) vs. control animals (black) at G85, G110 and G135.
Ethanol-exposed animals had a smaller fraction of large T2* values compared to controls across all time points, demonstrating decreased fetal oxygen availability in the former.

