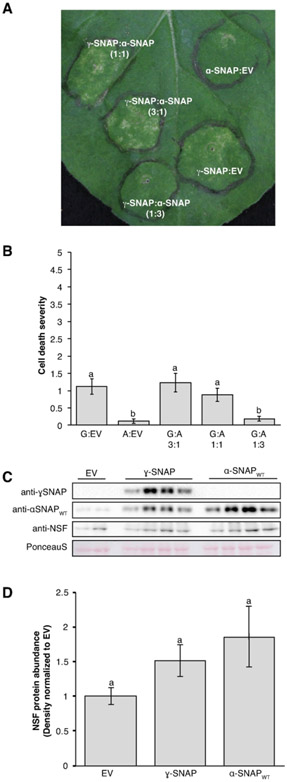
Figure 7. Transient expression of ɣ-SNAP in N. benthamiana leaves.
(A) Representative N. benthamiana leaf expressing ɣ-SNAP and wildtype soybean α-SNAP 8 days after infiltration with Agrobacterium strains at the indicated ratios. (B) Cell death ratings on a 0-5 scale, for multiple independent leaves. Means for treatments with the same letter are not statistically different (P > 0.05, pairwise Wilcoxon rank sum test). Data shown are mean and standard error of the mean; n = 26 for all but G:A 1:3 for which n = 21. G: ɣ-SNAP; A: α-SNAP. (C) Representative immunoblots verifying expression of the indicated proteins and used to measure NSF levels in leaf areas expressing ɣ-SNAP or wildtype soybean α-SNAP. NSF antibody detects N. benthamiana NSF. Blots were first probed for ɣ-SNAP and then stripped and simultaneously reprobed for α-SNAP and NSF. Ponceau S stain tests for equal loading across samples. (D). Densitometry analysis of NSF protein levels across three independent biological replicates consisting of three or four samples each (n = 10). Data were normalized to the empty vector (EV) control for each replicate; mean and standard error of the mean are shown. Means for treatments with the same letter are not statistically different (P > 0.1, ANOVA Tukey).

