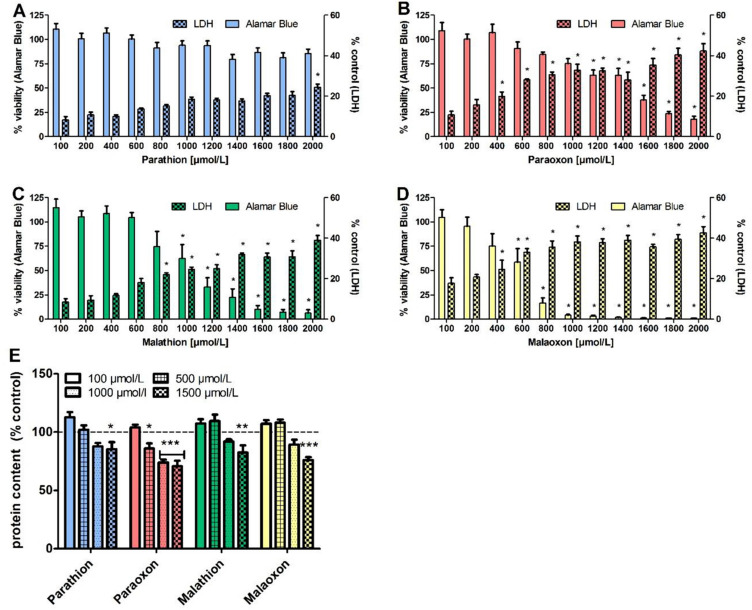
Fig. 2.
Effects of parathion, paraoxon, malathion and malaoxon on viability, cell death and protein content. PCLS were exposed for 24 h to different concentrations of parathion (A), paraoxon (B), malathion (C) or malaoxon (D) (10–2000 µmol/L). Viability was analyzed by Alamar Blue assay and effects on cellular death were evaluated by measurement of LDH release into PCLS supernatant. For detection of severe tissue destruction, intracellular protein content was detected by BCA assay (E). Data are presented as % of control (Alamar Blue assay and protein content) or as % of the positive control Triton-X (LDH). Data are shown as mean ± SEM. Asterisk indicate significant differences to control (*p < 0.05; **p < 0.01; ***p < 0.001; n = 6 PCLS from three different animals)

