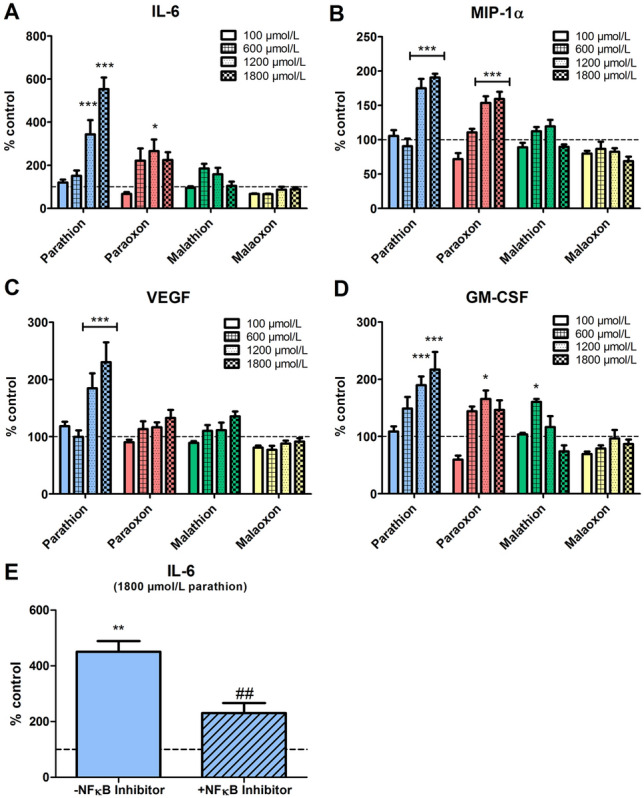
Fig. 3.

Expression of cytokines in PCLS after parathion, paraoxon, malathion and malaoxon exposure. PCLS were exposed to increasing concentrations of paraoxon, parathion, malaoxon, malathion (100–1800 µmol/L) for 8 h. Cytokine expression of IL-6 (A), MIP-1α (B), VEGF (C) and GM-CSF (D) was detected in the supernatant and cytosolic fraction using a Bioplex-system and was afterwards combined to analyze the overall cytokine production. Observed concentrations are corrected for the protein content and are shown as fold increase of control (indicated by dashed line). For evaluation of NF-κB activation, PCLS were exposed to parathion (1800 µmol/L) with or without addition of an NF-κB Activation Inhibitor (10 µmol/L; E). Interleukin-6 was detected in the supernatant and cytosolic fraction by ELISA, and afterwards combined to analyze the overall cytokine production. Data are shown as mean ± SEM. Asterisk indicate significant differences to the control (*p < 0.05; **p < 0.01; ***p < 0.001; n = 8 samples from four different animals) Hash characters indicate significant differences to parathion exposure without inhibitor (##p < 0.01; n = 8 samples from four different animals)
