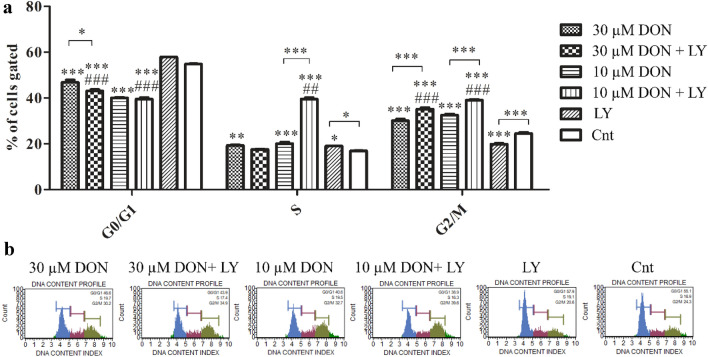
Fig. 3.
DON induces G2/M cell cycle arrest. a The analysis distribution of cells during cell cycle with representative plots (b). One-way ANOVA was used for statistical analysis of variances. P < 0.05 was considered as statistically significant. The results are presented and mean ± SE. *p < 0.05, **p < 0.01, ***p < 0.001 as compared to control or indicated value, ##p < 0.01, ###p < 0.001 as compared to Cnt + LY. DON-deoxynivalenol, Cnt- control, LY- LY294002, PI3K inhibitor

