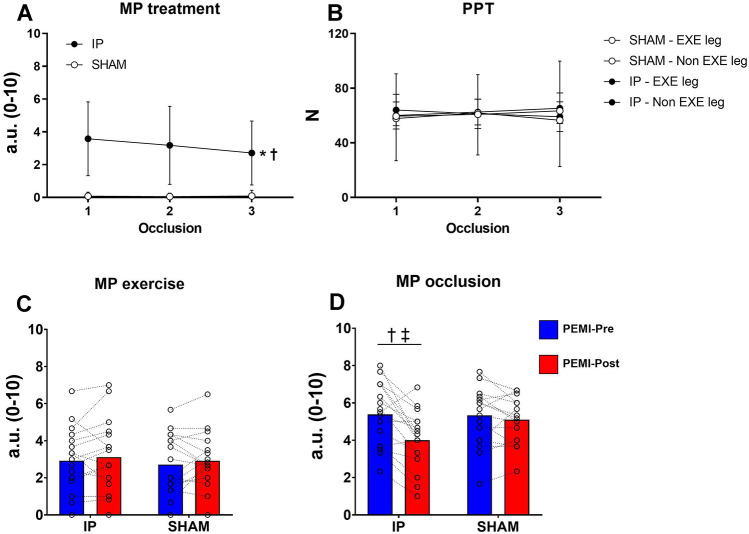
Fig. 4.
Absolute values of muscle pain intensity (MP) and pain pressure threshold (PPT) test. Panel A shows MP during ischemic preconditioning (IP) and sham (SHAM) treatment. Panel B shows PPT during ischemic preconditioning (IP) and sham (SHAM) treatment. Panel C shows MP during the exercise phase. Panel D shows MP during the occlusion phase. †Denotes significant condition × time interaction (p < 0.05); ‡Denotes significant difference at PEMI-Post in IP (p < 0.05). Values are presented as mean ± SD (n = 17)

