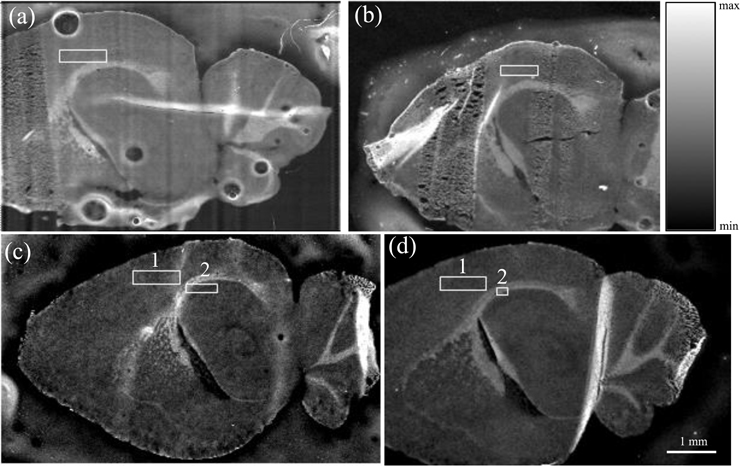
Figure 1. SXRF scans of the four mice brain samples under investigation utilizing the Compton scatter signal.
The locations of the high-resolution scans on the respective coarse scan are indicated. (a). Cortex region of the Ct4 sample. (b). Cortex region of the Ct7 sample. (c). (1) Cortex region of the Pb5 sample, and (2) Hippocampus/corpus callosum region of the Pb5 sample. (d). (1) Cortex region of the Pb7 sample, and (2) Hippocampus/corpus callosum region of the Pb7 sample

