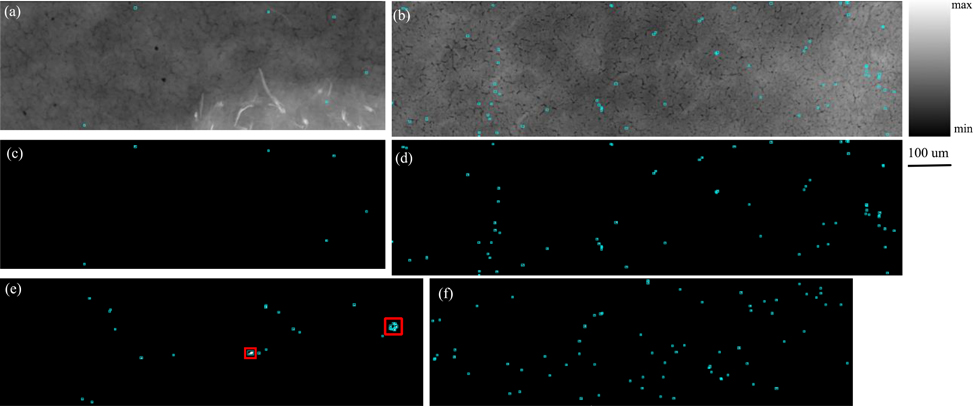
Figure 3. Distribution maps from the cortex region of each sample.
Cyan polygons indicate presence of Pb-containing particle. (a). Compton map of Ct4-c (900 × 301 pixels). (b). Compton map of Pb5-c (1210 × 321 pixels). (c). Pb mask image from Ct4-c (900 × 301 pixels). (d). Pb mask image from Pb5-c (1210 × 321 pixels). (e). Pb mask image from Ct7-c, with two regions of interest outlined in red (1000 × 301 pixels). (f). Pb mask image from Pb7-c (1000 × 301 pixels)

