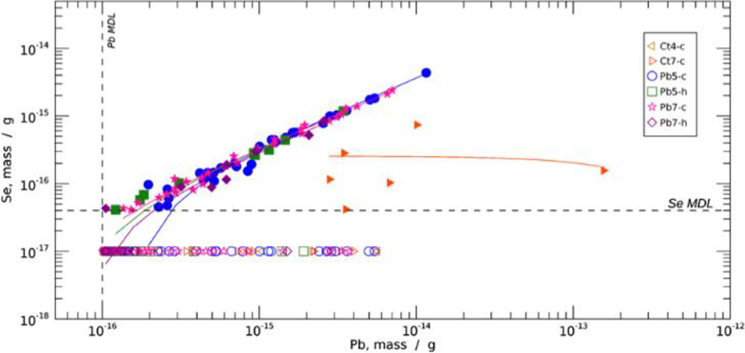
Figure 8. Scatterplot of Pb vs. Se mass for all detected Pb containing particles.
Pb particles with Se above (filled symbols) and below (open symbols, arbitrary Se value) the Se detection limit. A linear fit has been applied to the Pb/Se particles within each sample, with the linear coefficients indicated in Table 2. The MDLs for each element are as indicated.

