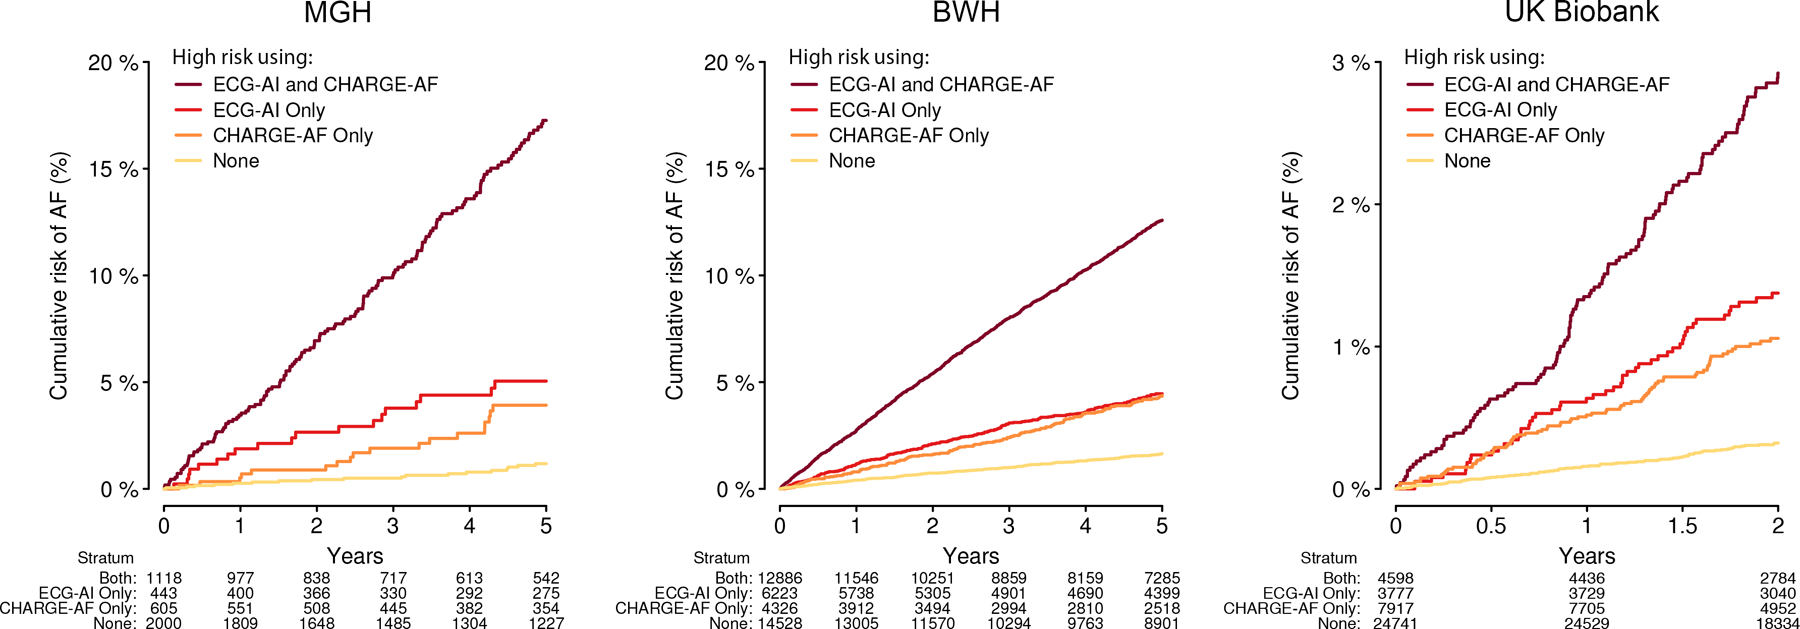
Figure 4. Cumulative risk of AF stratified by predicted AF risk.

Depicted is the cumulative risk of AF stratified by high predicted risk of AF as determined using both ECG-AI and CHARGE-AF (dark red), ECG-AI only (red), CHARGE-AF only (orange), or neither model (yellow). High AF risk was defined as 5-year AF risk ≥5% in MGH and BWH (as performed in the original CHARGE-AF derivation study),13 and 2-year AF risk ≥1% in the UK Biobank (approximating the top tertile of risk). The number at risk across each stratum over time is depicted below each plot.
