
Fig. 2. Schematic denoting regions of the hippocampus used for light and electron microscopy analysis.
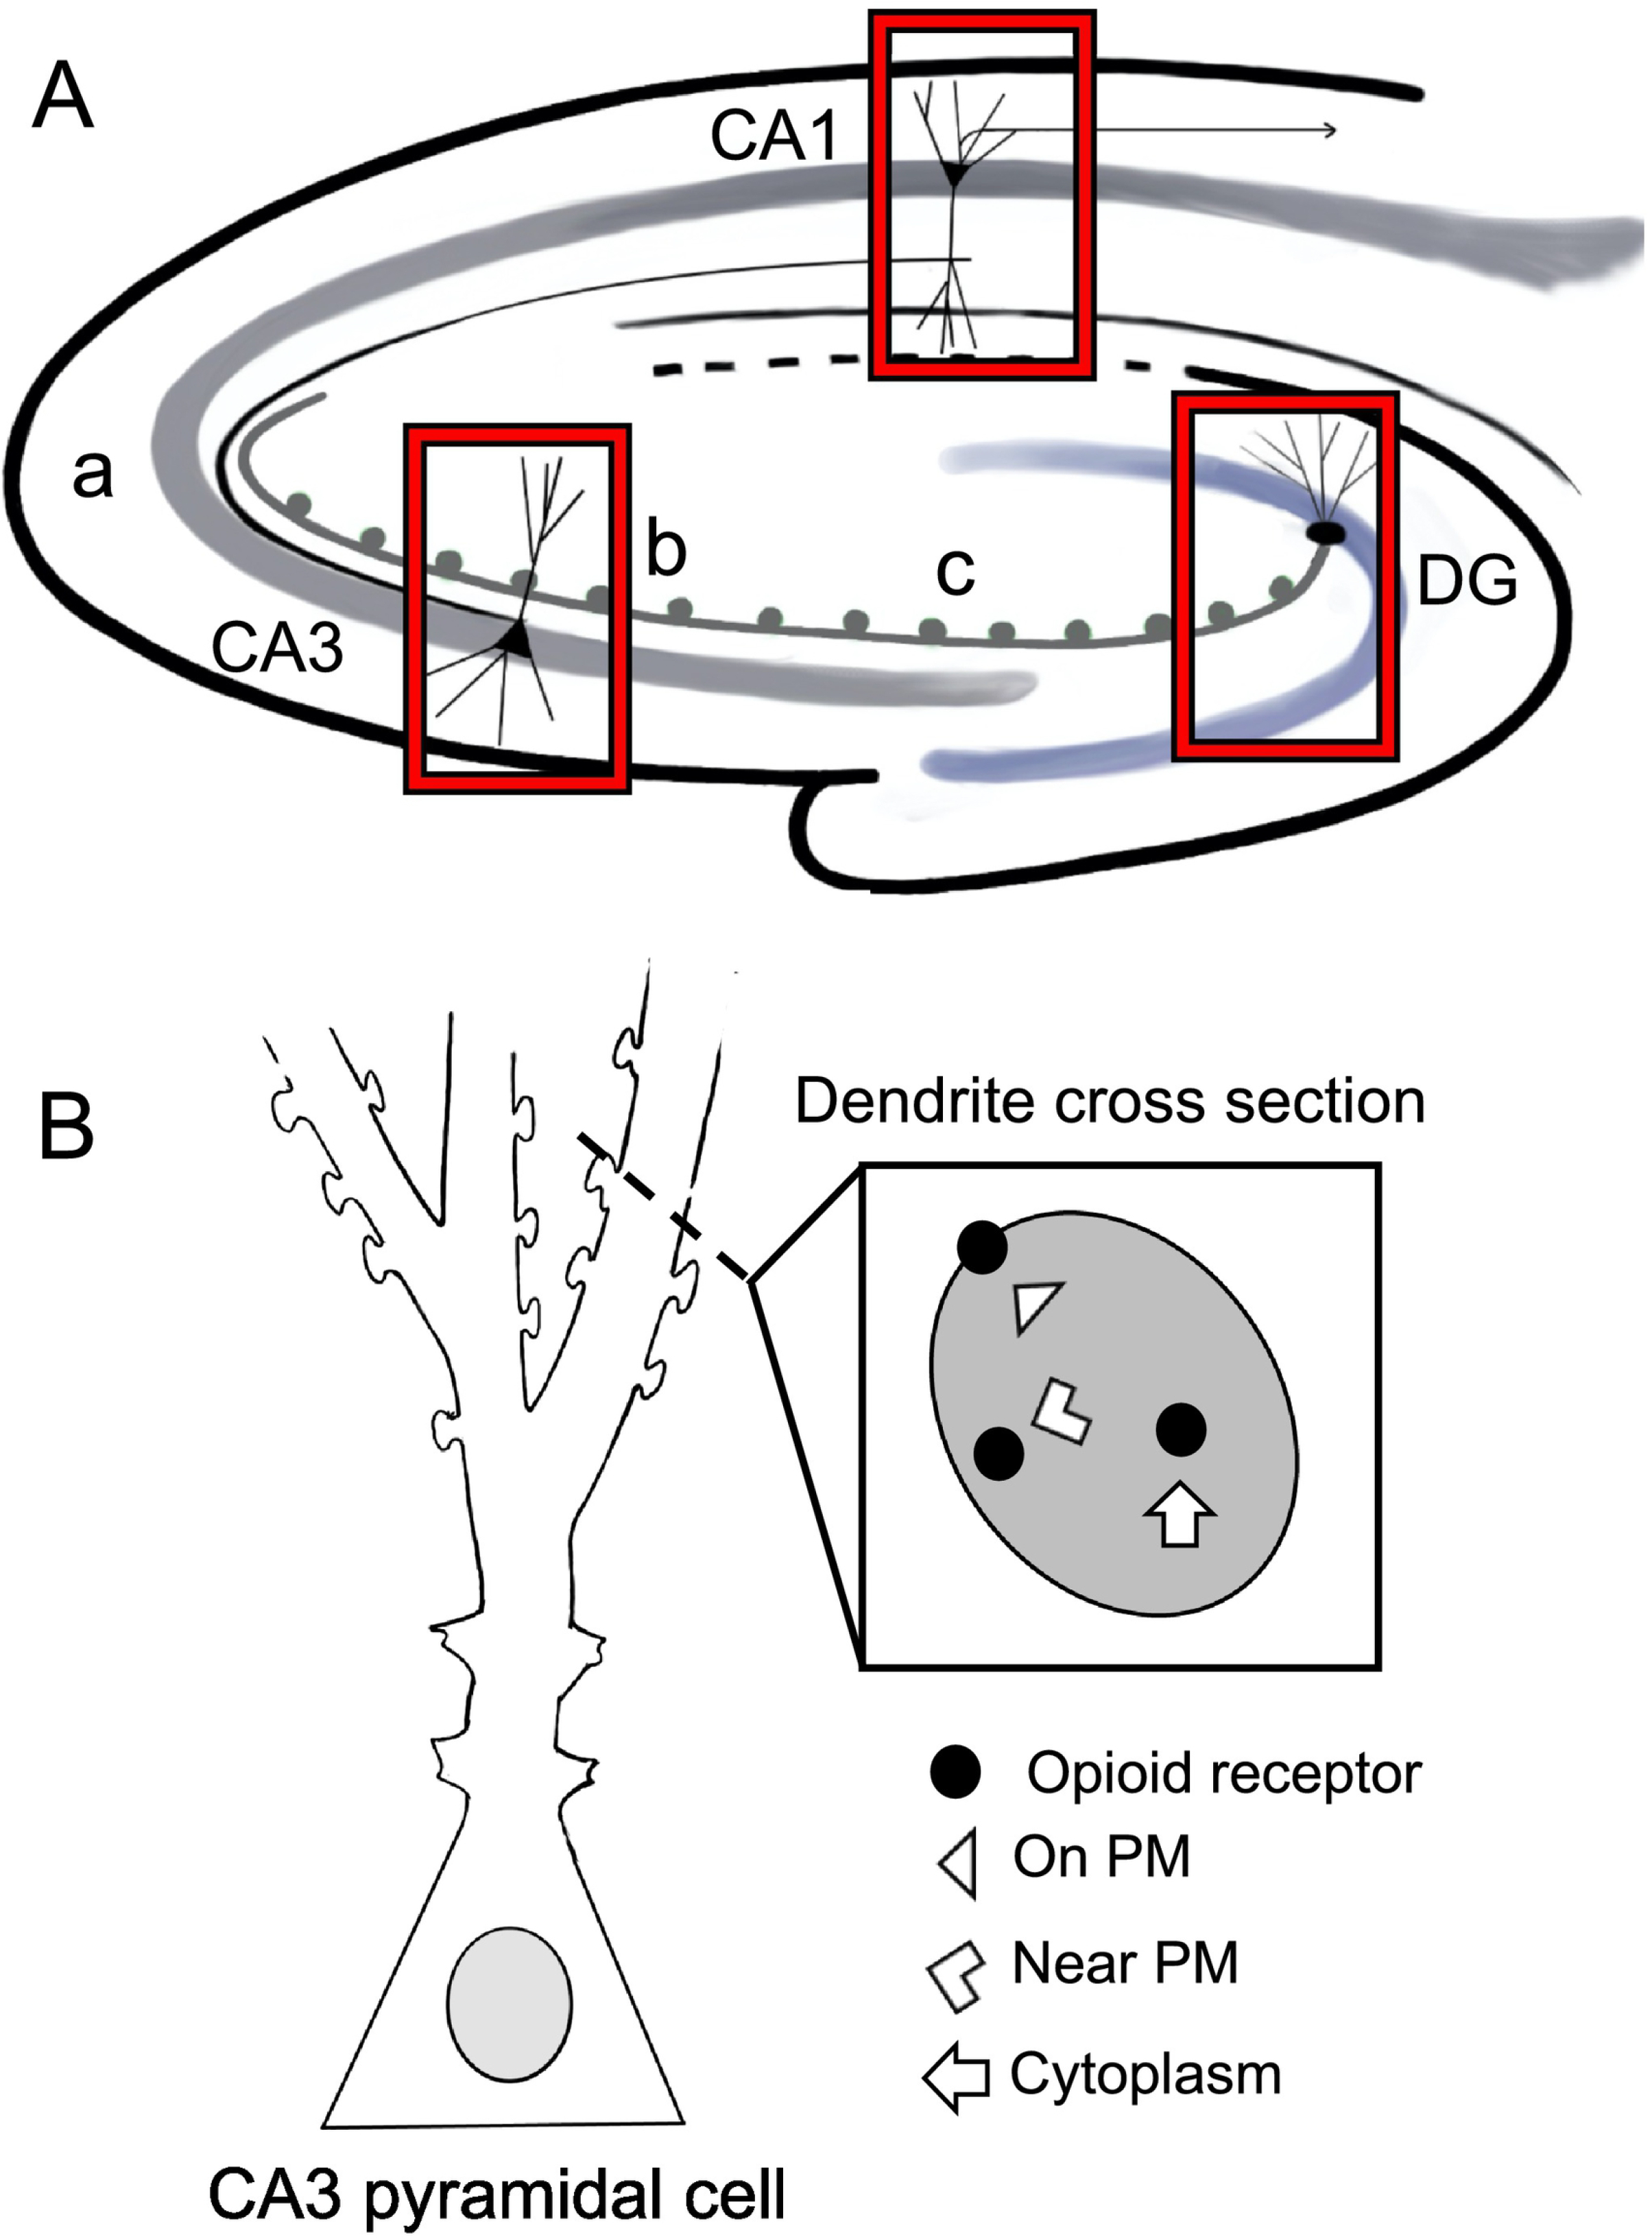
A. Schematic of a coronal section through the hippocampus showing the CA1, CA3 (a, b and c subregions) and dentate gyrus (DG) regions sampled for light and electron microscopy. B. Schematic of a dendritic cross section showing the subcellular compartmentalization of opioid receptors used for electron microscopy analysis.