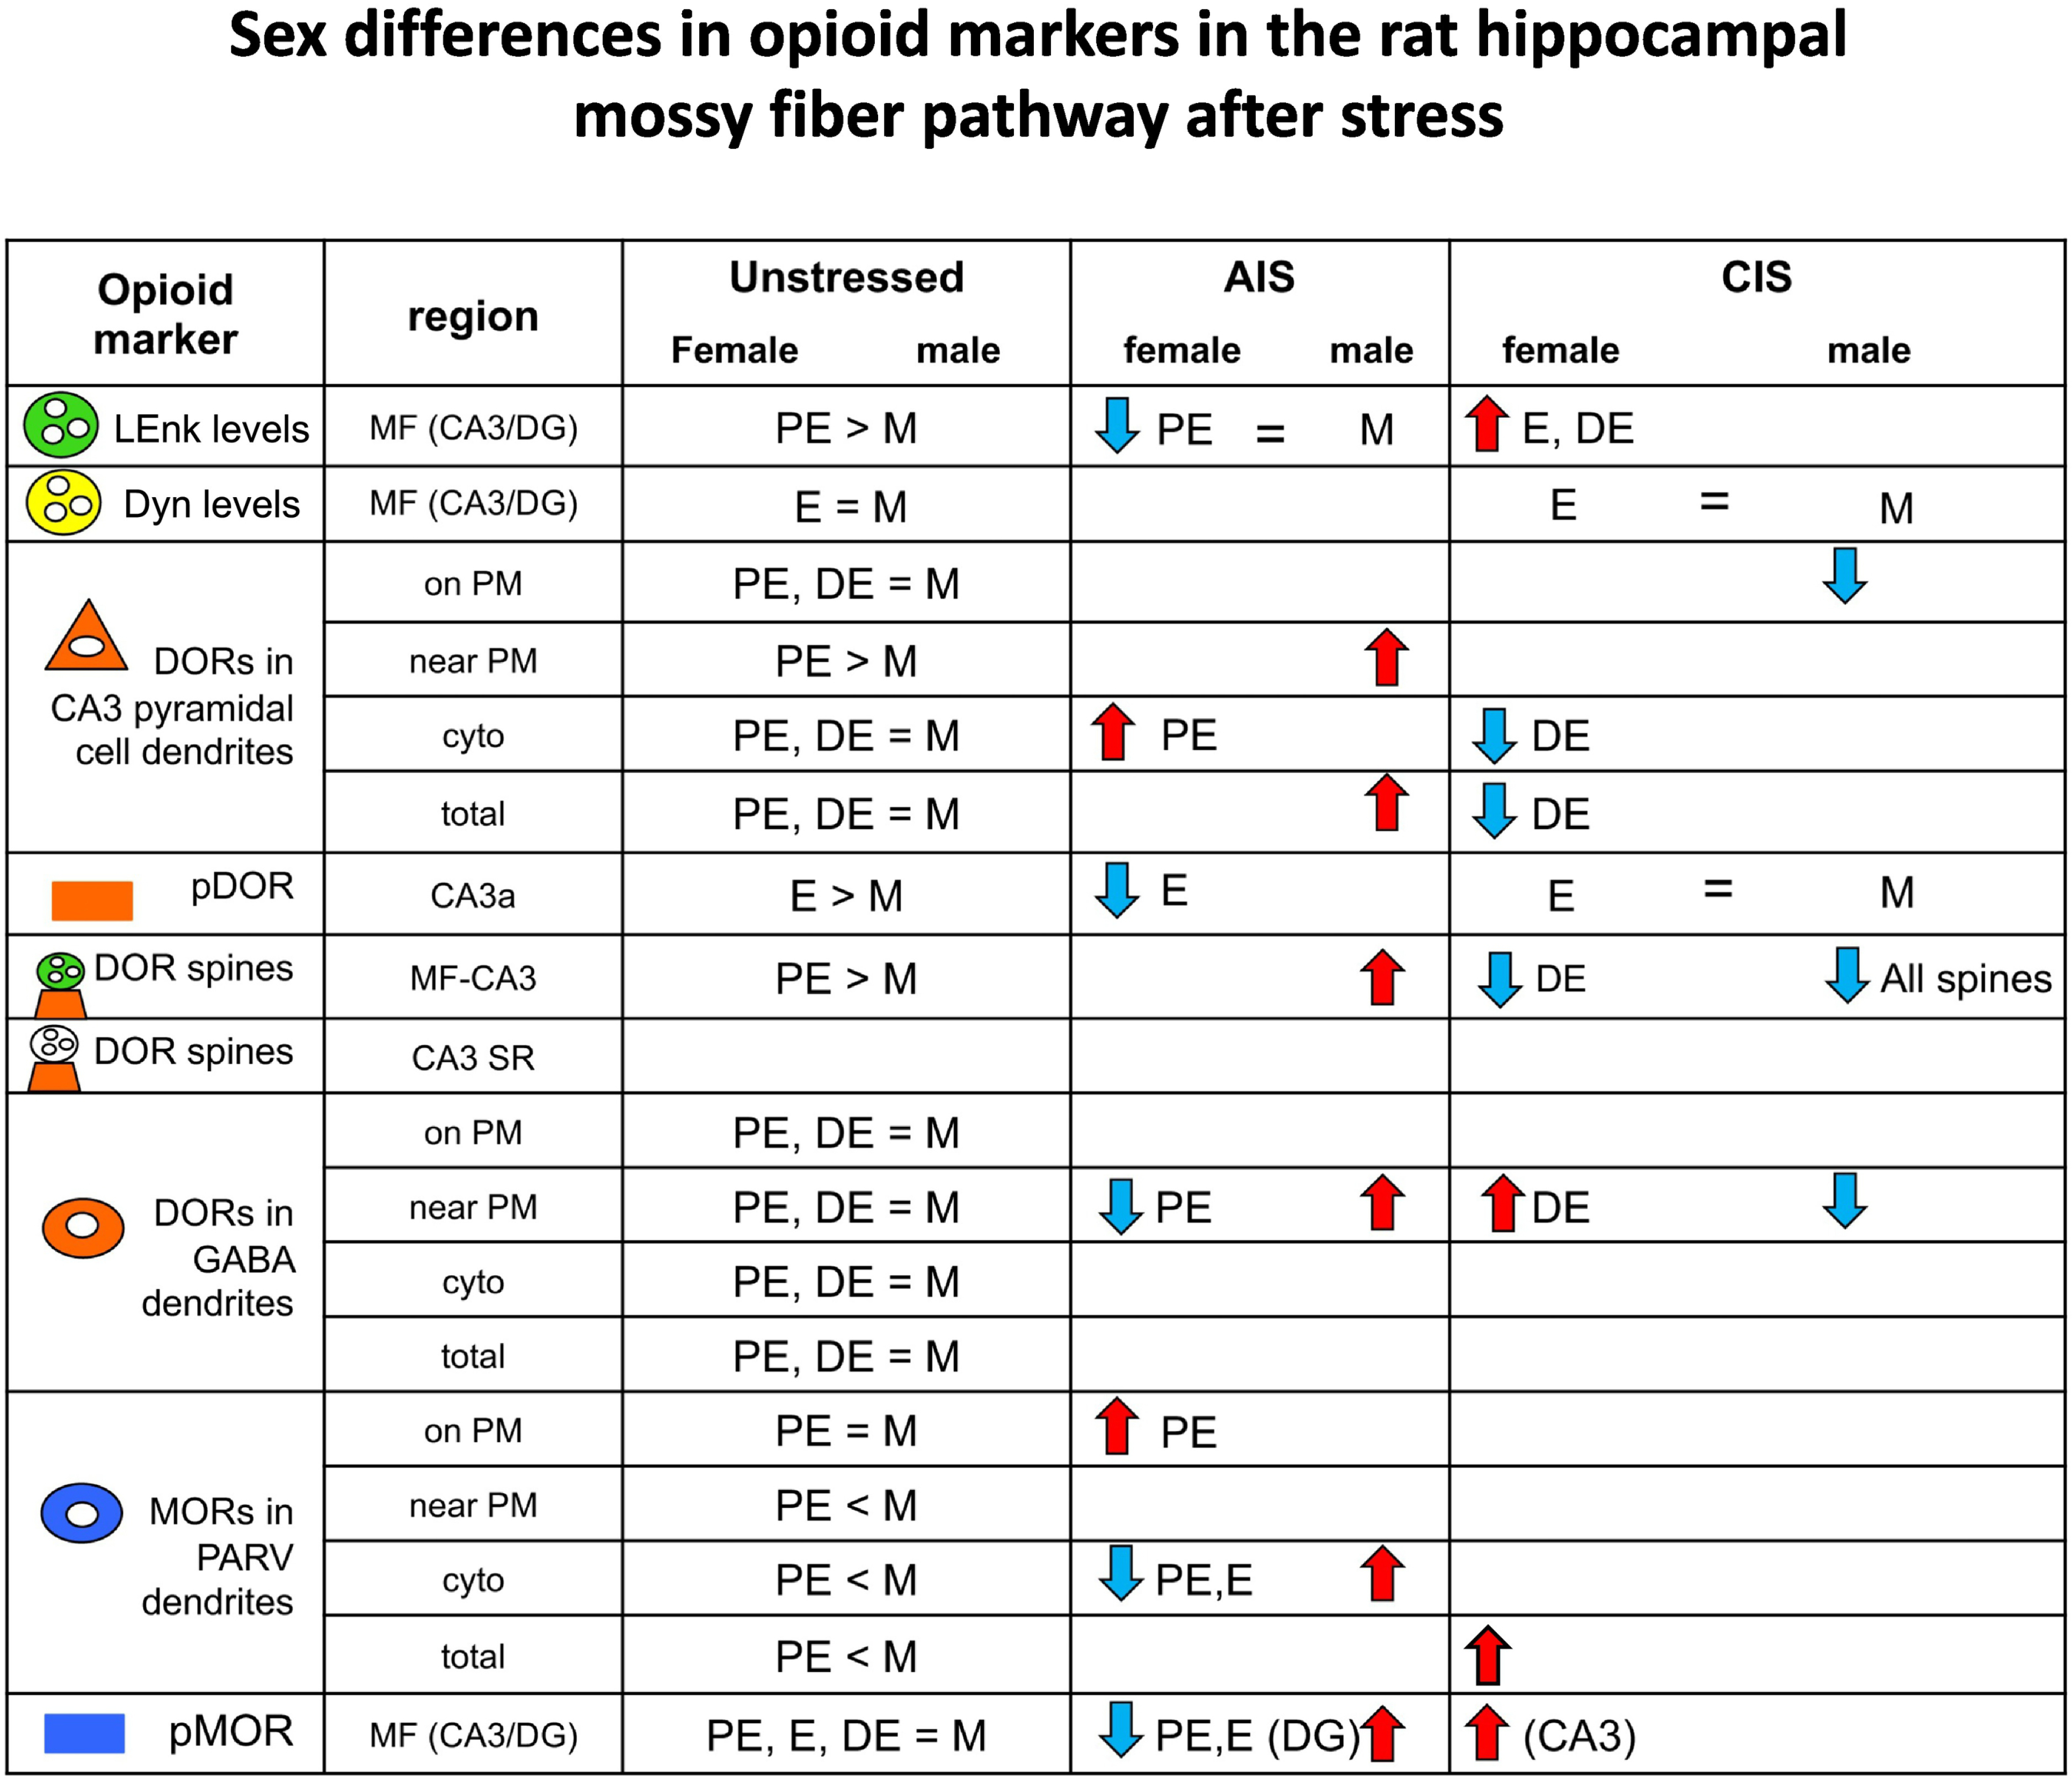
Fig. 7. Summary of sex differences in opioid markers in the rat hippocampal mossy fiber pathway following stress.

Comparisons of opioid markers in the DG and CA3 between females from different estrous states and males following acute immobilization stress (AIS) and chronic immobilization stress (CIS). Results for LEnk from Pierce et al (2014); results for DYN from Gregorie et al. (unpublished; CIS); results for pMOR from Gonzales et al., 2011(AIS); CIS - Bellamy et al 2019 (CIS); for pDOR from Burstein et al., 2013 (AIS); Bellamy et al., 2019 (CIS). for DORs from Mazid et al (2016); for MORs from Milner et al (2013). >, <, = signs indicate baseline differences. Arrows indicate the direction of change from baseline following AIS or CIS.
