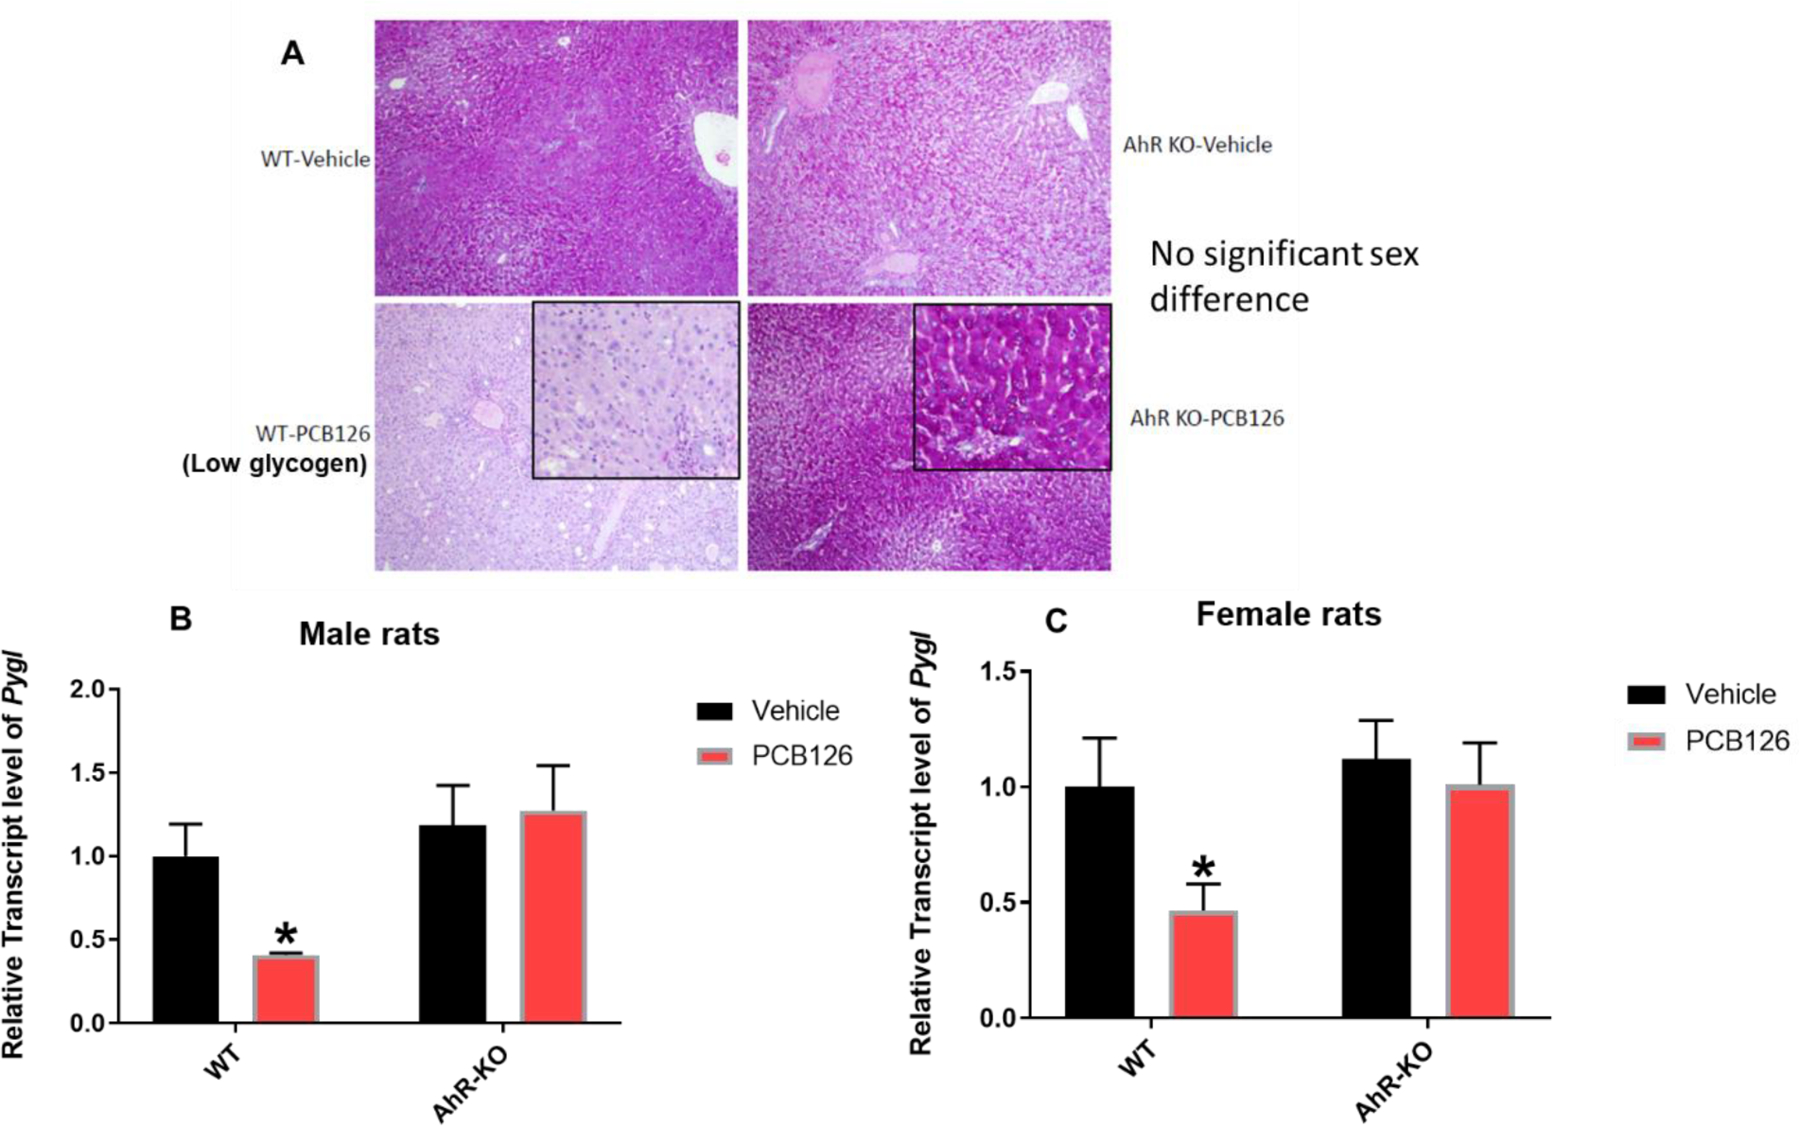
Fig-3: Low liver glycogen levels in WT-PCB126 rats and reduced glycogenolysis pathway gene.

PAS staining showed low glycogen in the liver of WT rats after PCB126 exposure (A). Liver transcript level of Glycogen Phosphorylase (Pygl) in male (B) and female rats (C) reported as mean ± SE. Statistical differences between WT control and treatment groups, and AhR-KO control and treatment groups were analyzed by Two-way ANOVA (*P <0.05; n=5 to 7 per group; n=3 for male WT-PCB126 for histology; and n= 3 to 5 for gene expression).
