
Figure 2.
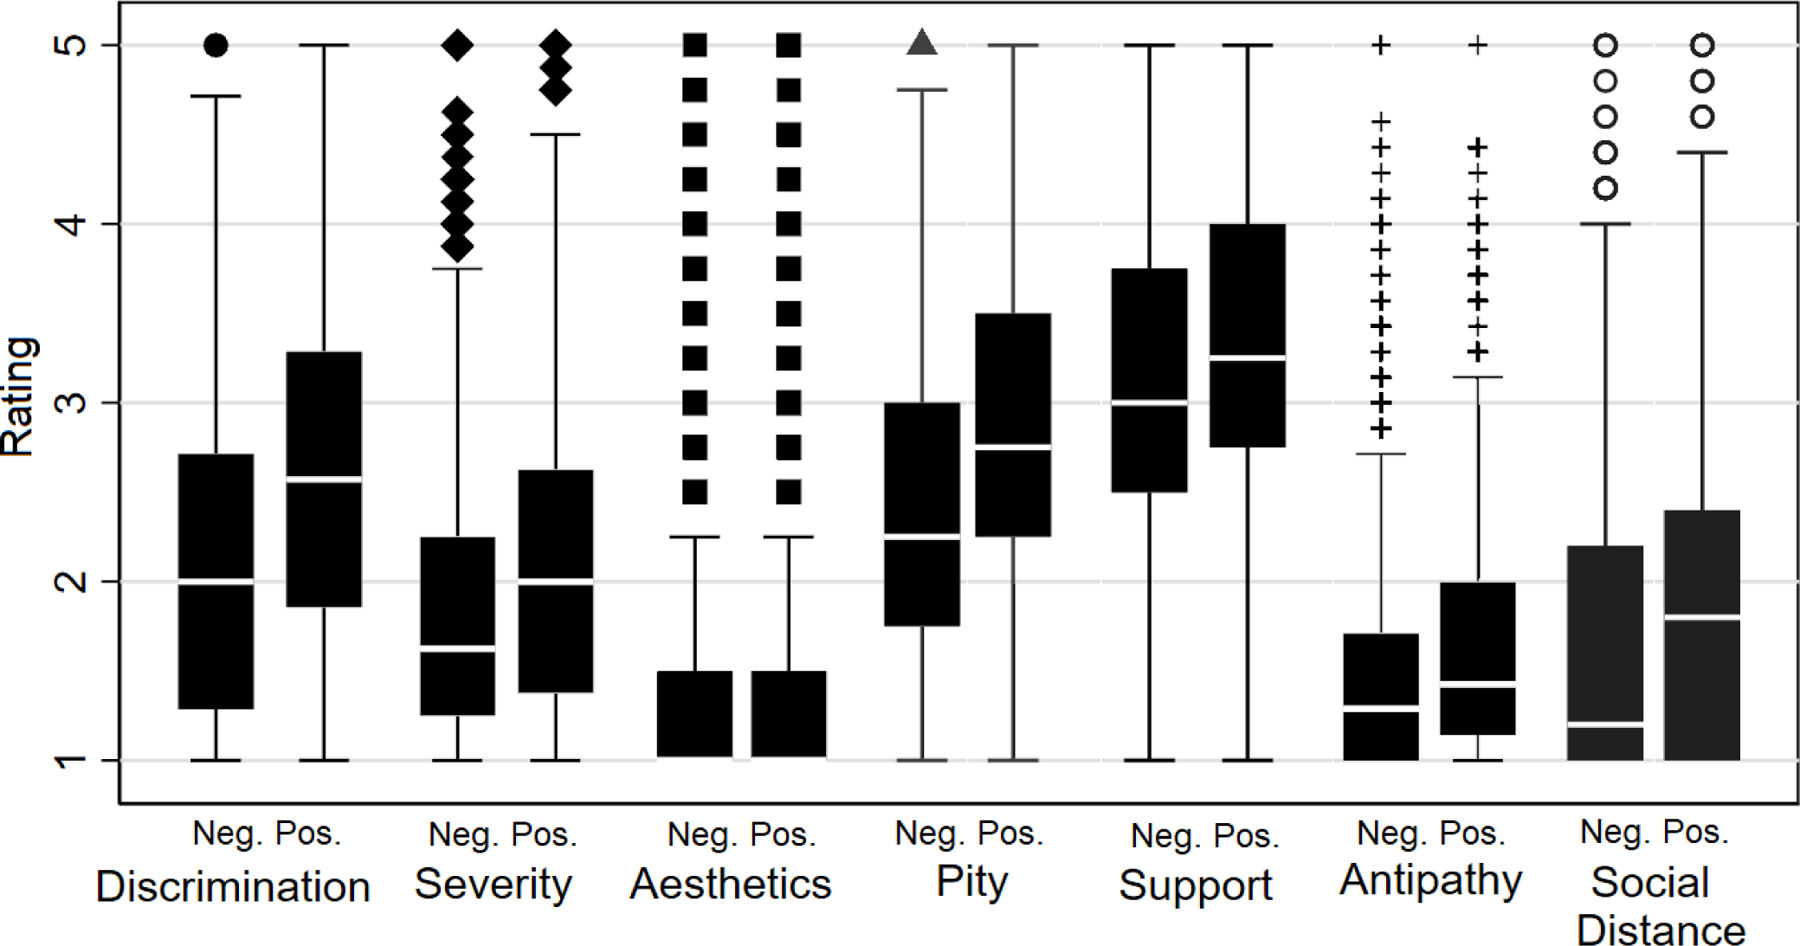
Box plot of domain distributions on Family Stigma in Alzheimer’s Disease Scale (FS-ADS) by biomarker test result.
Neg. = A negative Alzheimer’s disease biomarker test. Pos. = A positive Alzheimer’s disease biomarker test.
Legend: point = outlier, defined as a value more than 1.5 times the lower or upper quartile; upper and lower whiskers = maximum and minimum values, respectively, excluding outliers; top and bottom of rectangle = upper and lower quartiles, respectively; and white horizontal line = median value.