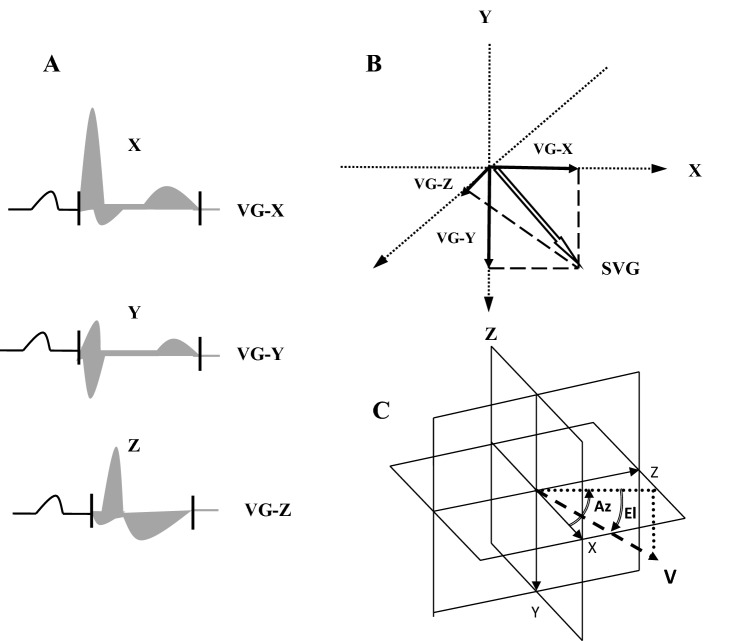
Figure 1.
(A) The QRS- and T-area vectors are calculated from the areas under the curves in the QRST x, y, and z complexes. (B) The ventricular gradient (VG) is the resultant vector of the QRS and T integral vector. (C) VG-RVPO the VG vector sum in a specific spatial direction providing an optimized projection for detection of RV pressure overload (VG magnitude at elevation 27° and azimuth 155°). Az, azimuth; El, elevation; V, heart vector; T, transverse palne; F, frontal plane; S, sagital plane. Measurements were performed using MEDEA device (licence number 245/2018, http://medea.pl/komputerowy-aparat-ekg/).

