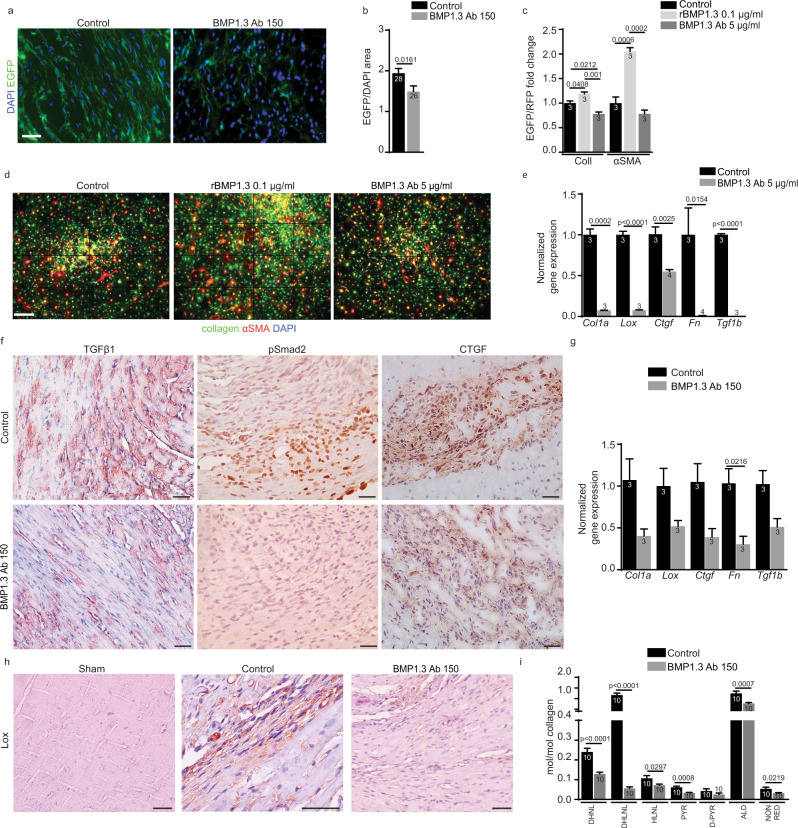
Fig. 2. Modulation of TGFβ target genes and enzymes involved in fibrosis by anti-BMP1.3 antibody.
a Representative images of heart sections from COLL-EGFP mice after MI (control) and after treatment with anti-BMP1.3 antibody (150 µg/kg). Nuclei were stained with DAPI. b Quantification of the EGFP + area normalized on DAPI + area. c Quantification of both EGFP+ or RFP+ pixels in cultured cardiac fibroblasts from COLL-EGFP/SMA-RFP mice untreated (control), treated with human recombinant BMP1.3 (rhBMP1.3, 0.1 µg/ml) or anti-BMP1.3 antibody (BMP1.3 Ab, 5 µg/ml). d Representative images of cultured cardiac fibroblast from COLL-EGFP/SMA-RFP mice treated as indicated. e Quantification of the expression levels of Col1a, Lox, Ctgf, Fn, and Tgf1b genes normalized to Gapdh in cultured cardiac fibroblasts treated as described. f Representative images from tissue section of infarct area of animals untreated (control) or treated with anti-BMP1.3 antibody (150 µg/kg) stained with anti-Tgfβ1, anti-phospho-Smad2 and anti-CTGF antibodies (brown) and hematoxylin (violet) to visualize nuclei. g Quantification of the expression levels of Col1a, Ctgf, Fn, Lox, and Tgf1b genes normalized to Gapdh in hearts, either untreated (control) or treated with anti-BMP1.3 antibody (150 µg/kg). h Representative images from tissue section of the heart of sham animals or animals subjected to MI, either in the absence of treament (control) or treated with anti-BMP1.3 antibody (150 µg/kg), stained with anti-Lox antibodies (brown) and hematoxylin (violet) to visualize nuclei. i Biochemical analysis of collagen crosslinking in scar tissue dissected from hearts of untreated rats (control) or rats treated with anti-BMP1.3 antibody (150 µg/kg). DHNL dihydroxynorleucine, DHLNL dihydroxylysinonorleucine, HLNL hydroxylysinonorleucine, Pyr pyridinoline, d-Pyr deoxypyridinoline, ALD total aldehyde, NON RED non reduced aldehyde. Data in b, c, e, g and i are shown as mean ± s.e.m. Sample number is indicated inside or above each bar. Statistical significance was determined using unpaired, two-sided t-test in b, e, g and i or one-way ANOVA followed by Tukey’s multiple comparison test in c. Scale bars in a, f and h is 100 µm, while in d is 500 µm. Source data are provided as a Source Data file.

