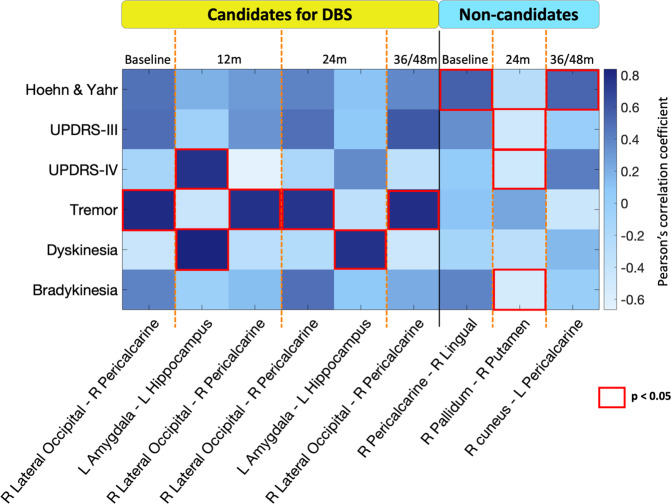
Fig. 4. Clinical-MRI correlations between functional network properties and clinical data in each Parkinson’s disease group.
Each column shows functional brain proprieties and each row clinical data at baseline and at each time point. Color scale represents Pearson’s correlation coefficient. Red squares indicate statistical significance at a threshold of p < 0.05. For further details see Supplementary Table 4. Candidates for DBS patients eligible for DBS, L left, m months, Non-candidates patients not eligible for DBS, R right, UPDRS Unified Parkinson’s disease rating scale.

