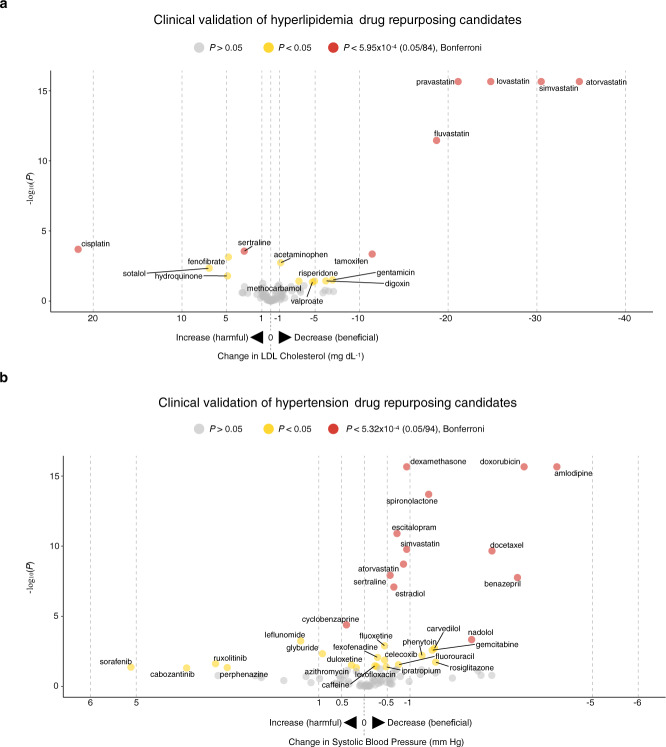
Fig. 3. Clinical validation study results for drug repurposing candidates in VUMC EHR database.
a Results from clinical validation studies for hyperlipidemia repurposing candidates. b Results from clinical validation studies for hypertension repurposing candidates. For hyperlipidemia, the biomarker was LDL-C; for hypertension, the biomarker was SBP. On the vertical axis, −log10(P) is plotted; on the horizontal axis, change in biomarker measurements from baseline after drug exposure is plotted. Each point indicates one drug. On the horizontal axis, drugs plotted to the right of 0 indicate that individuals experienced reductions in biomarker measurements after drug exposure. Drugs plotted to the left of 0 indicate that individuals had elevated biomarker measurements after drug exposure. Two-tailed P values were calculated using linear mixed models. Drugs with P > 0.05 are in gray, P < 0.05 are in yellow, and P values that passed Bonferroni significance (to correct for multiple comparisons) are in red. Drugs with P < 2.2 × 10⁻¹⁶ were transformed to 2.2 × 10⁻¹⁶ for visualization purposes. EHR electronic health record, VUMC Vanderbilt University Medical Center, SD Synthetic Derivative, LDL-C low-density lipoprotein cholesterol, SBP systolic blood pressure.

