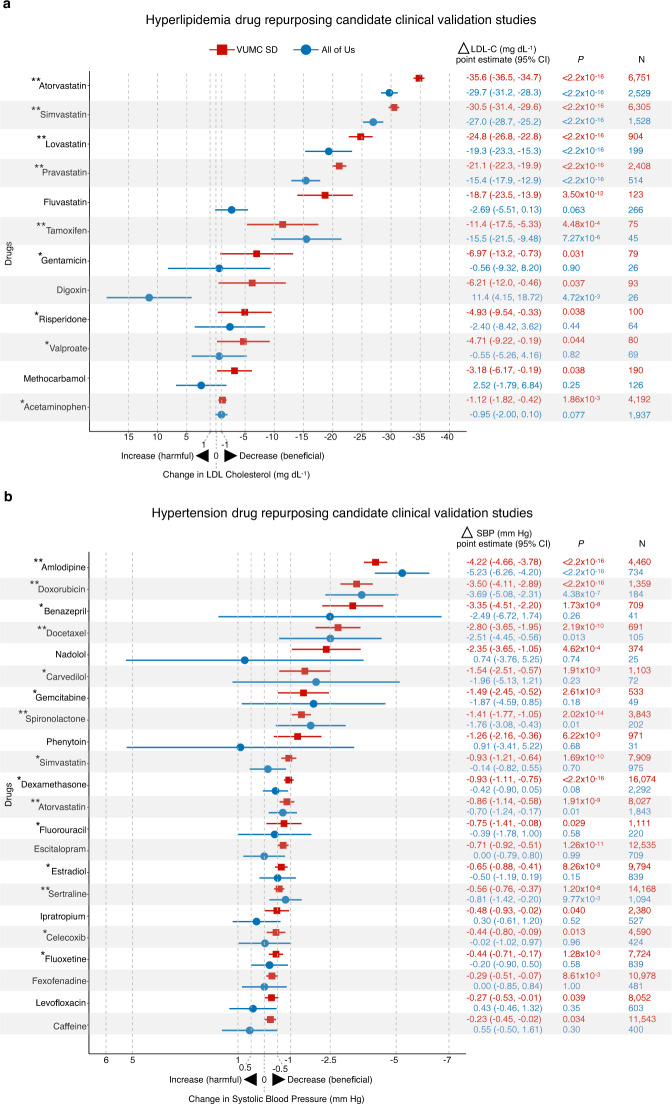
Fig. 4. Comparison of clinical validation study treatment effects.
Forest plots and treatment effect statistics for clinical validation studies in the VUMC SD (red squares) and NIH All of Us Research Program (blue circles) databases. a Hyperlipidemia clinical validation studies. b Hypertension clinical validation studies. Plotted are biomarker changes after drug exposure, represented as point estimates (95% CI) from linear mixed models. Drugs with point estimates plotted to the right of 0 indicate that individuals had lower biomarker measurements after drug exposure. Drugs with point estimates plotted to the left of 0 indicate that individuals had elevated biomarker measurements after drug exposure. Two-tailed P values were calculated using linear mixed models. “**“ are drugs with replicated treatment effects in the All of Us study at P < 0.05. “*“ are drugs that reduced biomarker levels (i.e., negative point estimates) in the All of Us study with P > 0.05 and had 95% CIs that overlapped with the 95% CIs from the VUMC SD study. VUMC Vanderbilt University Medical Center, SD Synthetic Derivative, N number of individuals, NIH National Institutes of Health, LDL-C low-density lipoprotein cholesterol, 95% CI 95% confidence interval.

