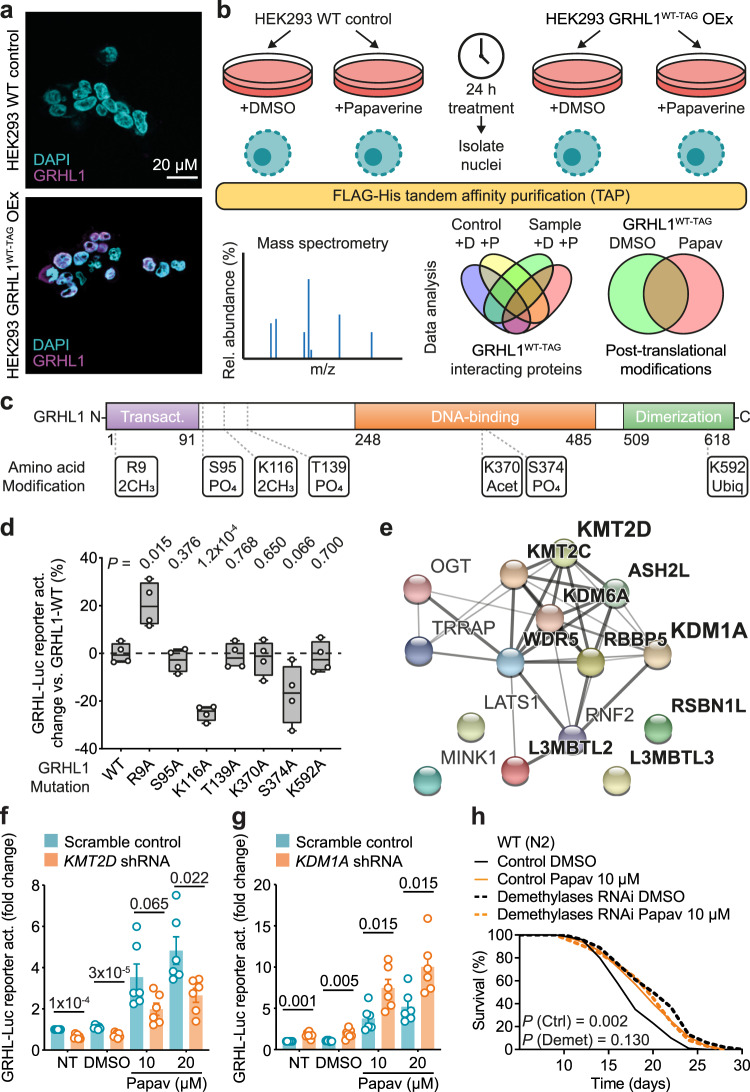
Fig. 4. GRH-1/GRHL1 are regulated by lysine methylation.
a Microscopy images of a HEK293 wild-type (WT) and the GRHL1WT-TAG-overexpressing cell line as DAPI staining and GRHL1 immunofluorescence overlay. See Supplementary Fig. 3h. b Experimental design of GRHL1WT-TAG tandem-affinity purification (TAP) from isolated nuclei and subsequent mass spectrometry. c Post-translational modifications (PTMs) of human GRHL1 identified only after treatment with papaverine. Position, amino acid, and type of PTM as indicated (2CH3 = dimethylation, PO4 = phosphorylation, Acet = acetylation, Ubiq = ubiquitylation). See Supplementary Table 1 and Supplementary Data 6. d Impact of mutating individual GRHL1 amino acids on GRHL reporter activation. Depicted is percentage change vs. activation with the GRHL1 WT control with n = 4 for all. Box plot center lines indicate the median, bounds of boxes indicate the 25th to 75th percentiles, and whiskers indicate minima and maxima. e Protein–protein interaction network of GRHL1 interactors classified as impacting PTMs. Edges represent known protein–protein interactions, with darker color indicating stronger data support. Proteins in bold are linked to K-methylation. Visualized with the help of STRING (https://string-db.org). See Supplementary Fig. 3j and Supplementary Data 5. f, g Activation of the GRHL reporter without (scramble control) or with concomitant knockdown of KMT2D (f) or KDM1A (g) by shRNA and indicated treatments (NT = no treatment, DMSO = vehicle control, Papav = papaverine at 10 or 20 µM). KMT2D and KDM1A scramble vs. shRNA with n = 7 for NT and DMSO and n = 6 for Papav. h Lifespan assay of WT (N2) nematodes on post-developmental lsd-1 + spr-5 demethylases RNAi compared to control vector L4440, and both conditions additionally treated with 10 µM papaverine or DMSO control. Data in bar graphs are mean ± SEM, with sample sizes as stated and individual data points representing biological replicates. P-values were determined with two-tailed unequal variances t-tests of the indicated comparisons of unpaired control vs. treatment groups. P-values of C. elegans lifespan assays were determined by log-rank test. See Supplementary Data 1 for detailed lifespan assay statistics. Source data are provided as a Source data file.

