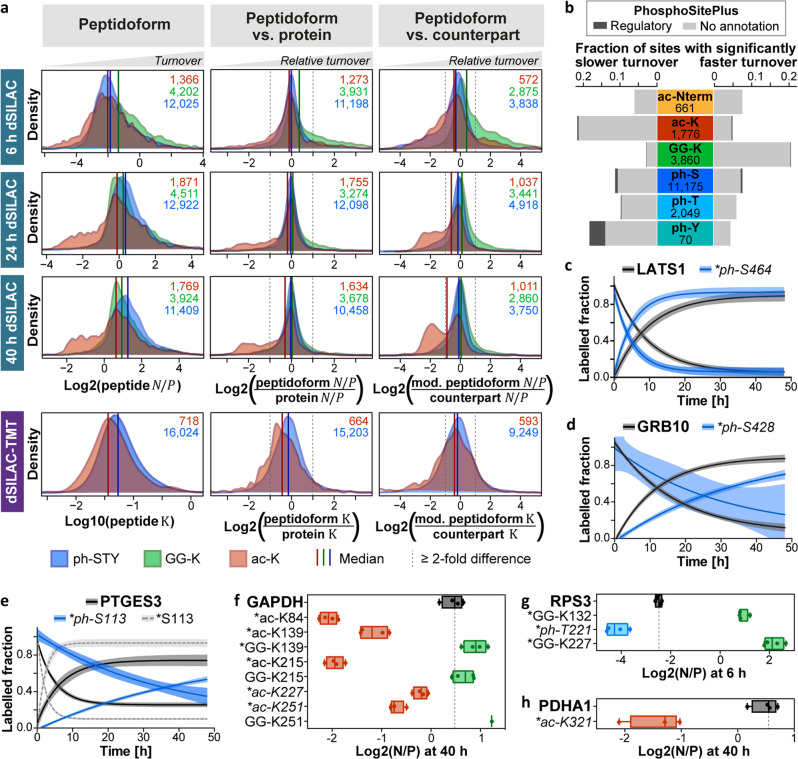
Fig. 2. Global and site-specific associations of PTMs and protein turnover.
a Distributions of newly synthesized-to-pre-existing () ratios and turnover rates () for modified peptidoforms (left column) and distributions of their ratios and values relative to the ratios and values of their corresponding proteins (middle column) or unmodified counterpart peptides (right column). Ratios to proteins and counterparts were calculated based on the median of log2 values across n = 4 cell culture replicates. For the comparison to the protein turnover, only proteins with at least three peptides were included. Numbers of included peptidoforms are given in the top right corner (blue/ph-STY: phosphorylated serine/threonine/tyrosine; green/GG-K: lysine with ubiquitin-remnant; red/ac-K: acetylated lysine). b Fraction of modified sites showing a significantly slower or faster measured turnover compared to the corresponding protein or unmodified counterpart site. Total numbers of statistically tested PTMs are indicated. The fraction of sites with functional annotations according to the PhosphoSitePlus database are shown in dark gray. c–e Turnover curves for three example proteins and their phosphosites. Displayed sites have been described to increase protein degradation (LATS1_ph-S464), stabilize the protein (GRB10_ph-S428), or enhance enzymatic activity and protein interaction with Hsp90 (PTGES3_ph-S113). Shaded areas illustrate 95 % confidence intervals and lines represent means of n = 4 cell culture replicates, except for LATS1 label loss, GRB10_ph-S428 label incorporation (both n = 3), LATS1_ph-S464 label loss (n = 2), and GRB10_ph-S428 and PTGES3_ph-S113 label loss (both n = 1). f-h Tukey-boxplots of log2 ratios for three example proteins and selected modified sites (box borders: 1st and 3rd quartile; lines in boxes: medians; whiskers: ranging to greatest value within 1.5× interquartile range; dots: replicate measurements; dashed line: median of protein ; *: significantly different turnover to protein or unmodified counterpart). Known regulatory sites are italicized and have been reported to cause nuclear translocation (GAPDH_ac-K227/251, RPS3_ph-T221), induce endonuclease activity (RPS3_ph-T221), or regulate the interaction with PDK1 (PDHA1_ac-K321). Boxplots are based on n = 4 cell culture replicates, except for GAPDH_ac-K251, PDHA1_ac-K321 (both n = 3), and GAPDH_GG-K251 (n = 1). PTM positions are given for the major protein isoform. For panels c–h, the number of peptides and spectra included varies for each site/protein and replicate and can be retrieved from Supplementary Data 1. Source data are provided as a Source Data file.

